19
19peptides
spectra
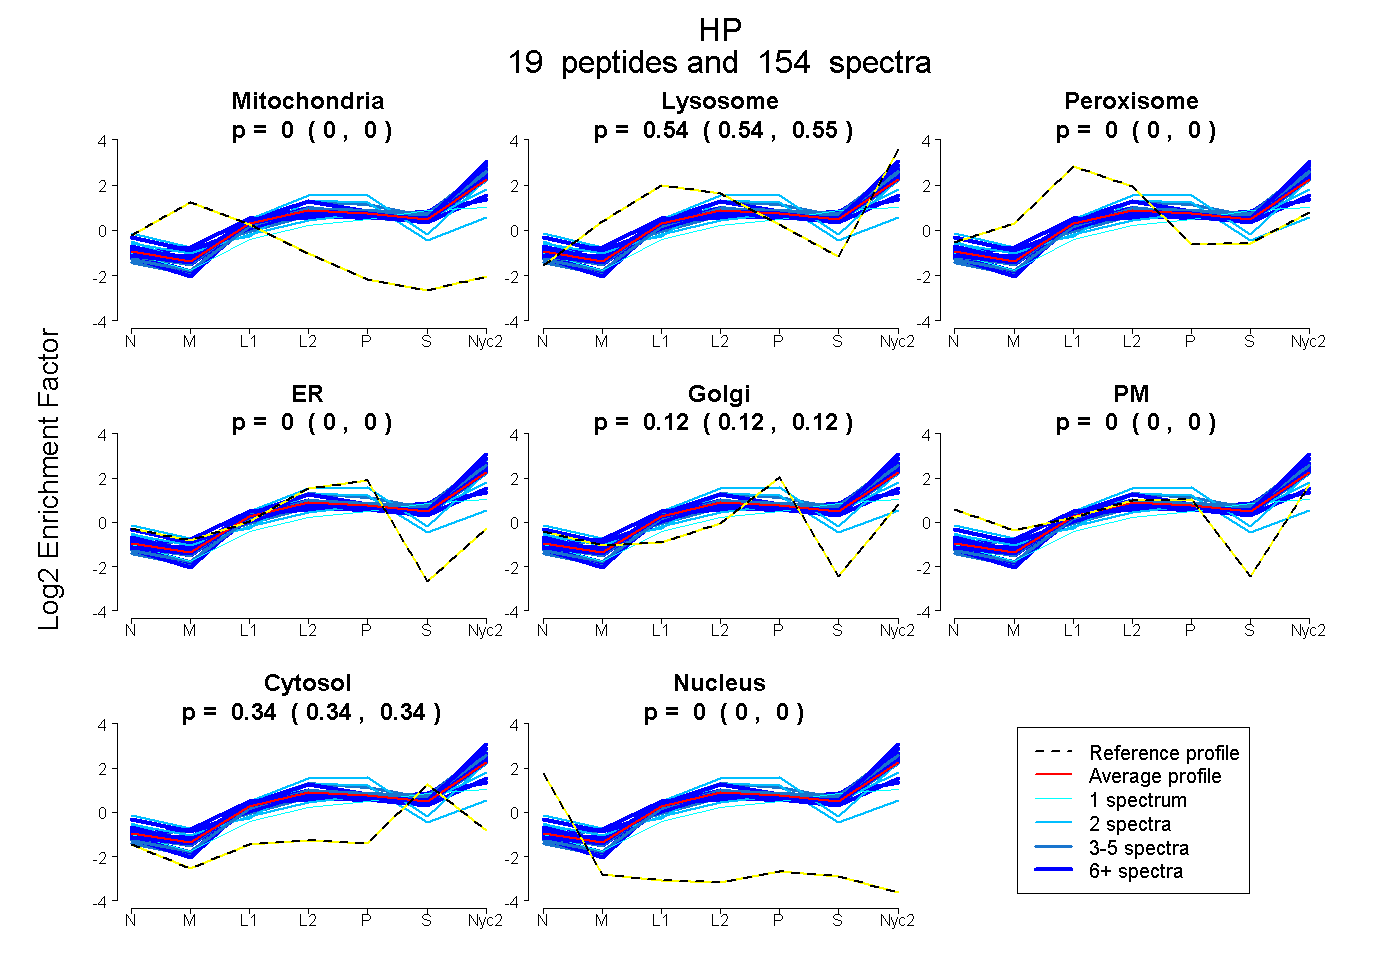
0.000 | 0.000
0.540 | 0.545
0.000 | 0.000
0.000 | 0.000
0.117 | 0.122
0.000 | 0.000
0.335 | 0.339
0.000 | 0.000
14peptides
spectra
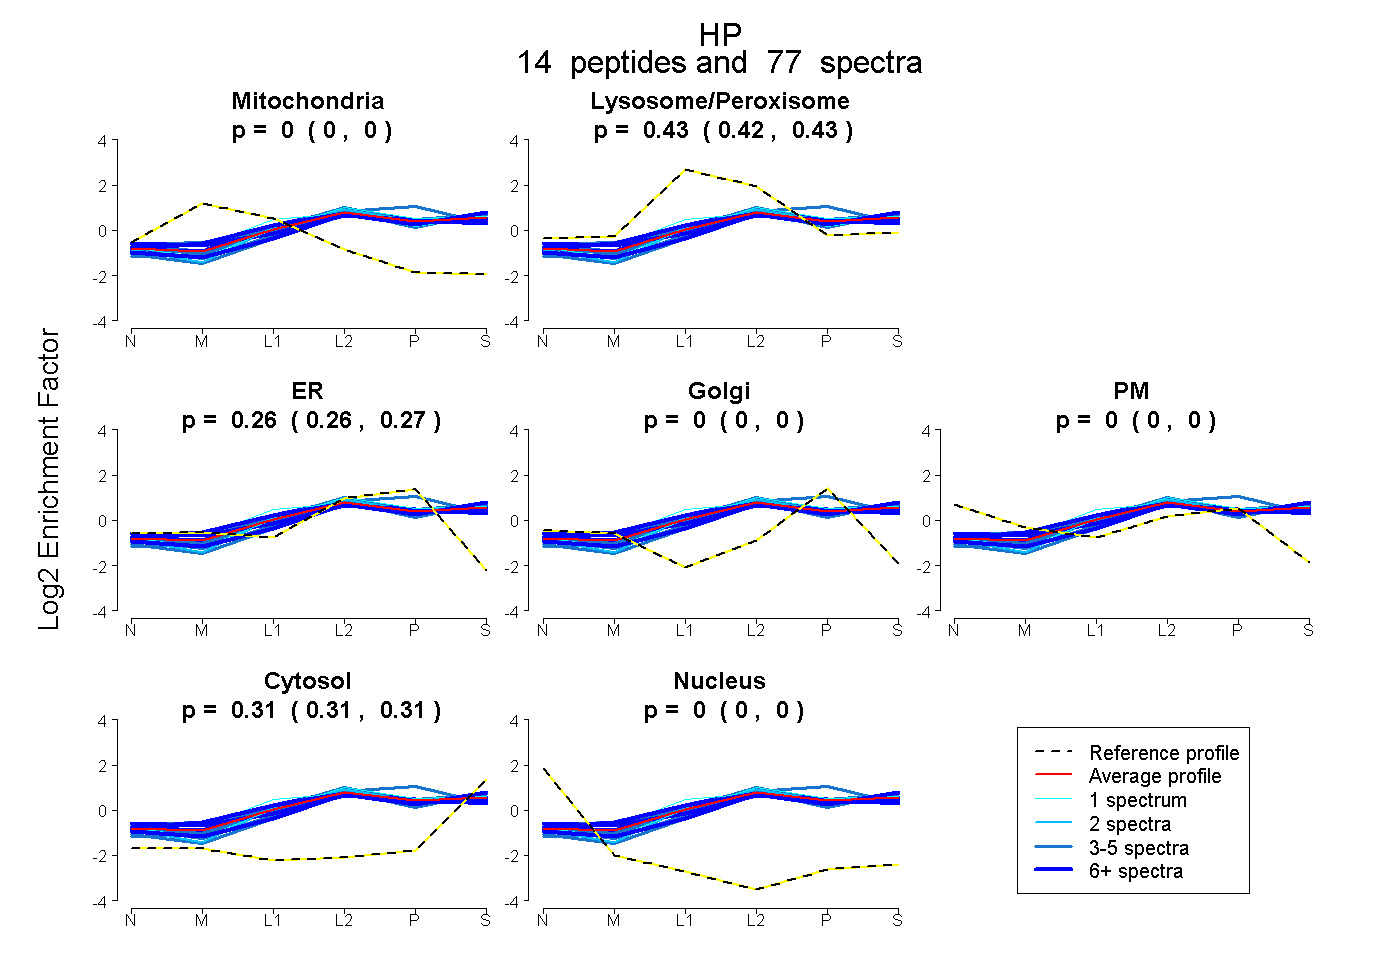
0.000 | 0.000
0.423 | 0.428
0.261 | 0.267
0.000 | 0.000
0.000 | 0.000
0.308 | 0.312
0.000 | 0.000