 4
4peptides
spectra
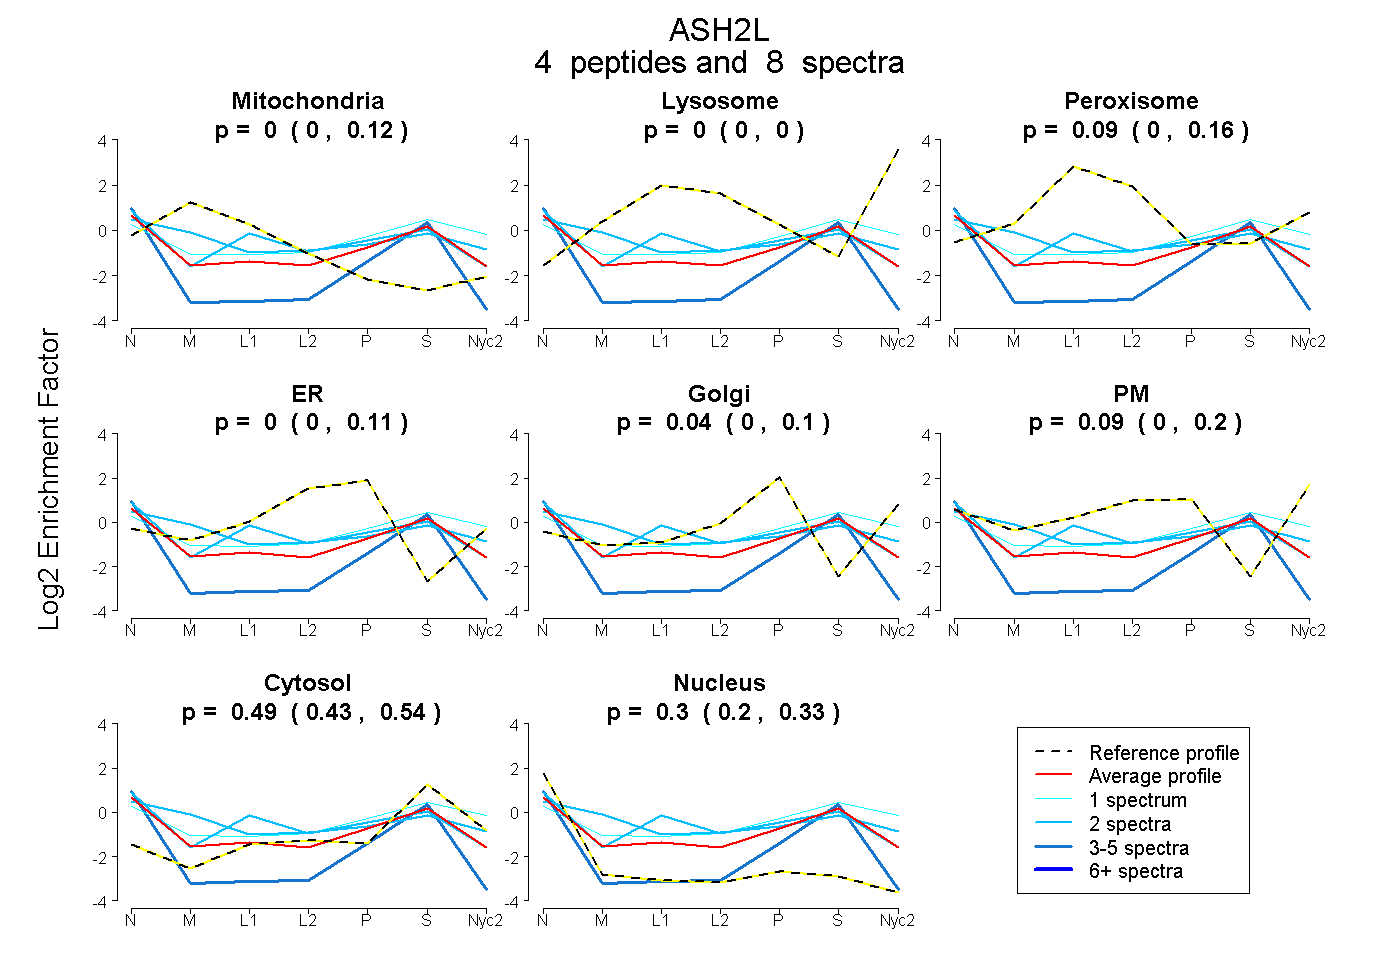
0.000 | 0.121
0.000 | 0.000
0.000 | 0.164
0.000 | 0.114
0.000 | 0.097
0.000 | 0.196
0.433 | 0.542
0.205 | 0.326
1peptide
spectra
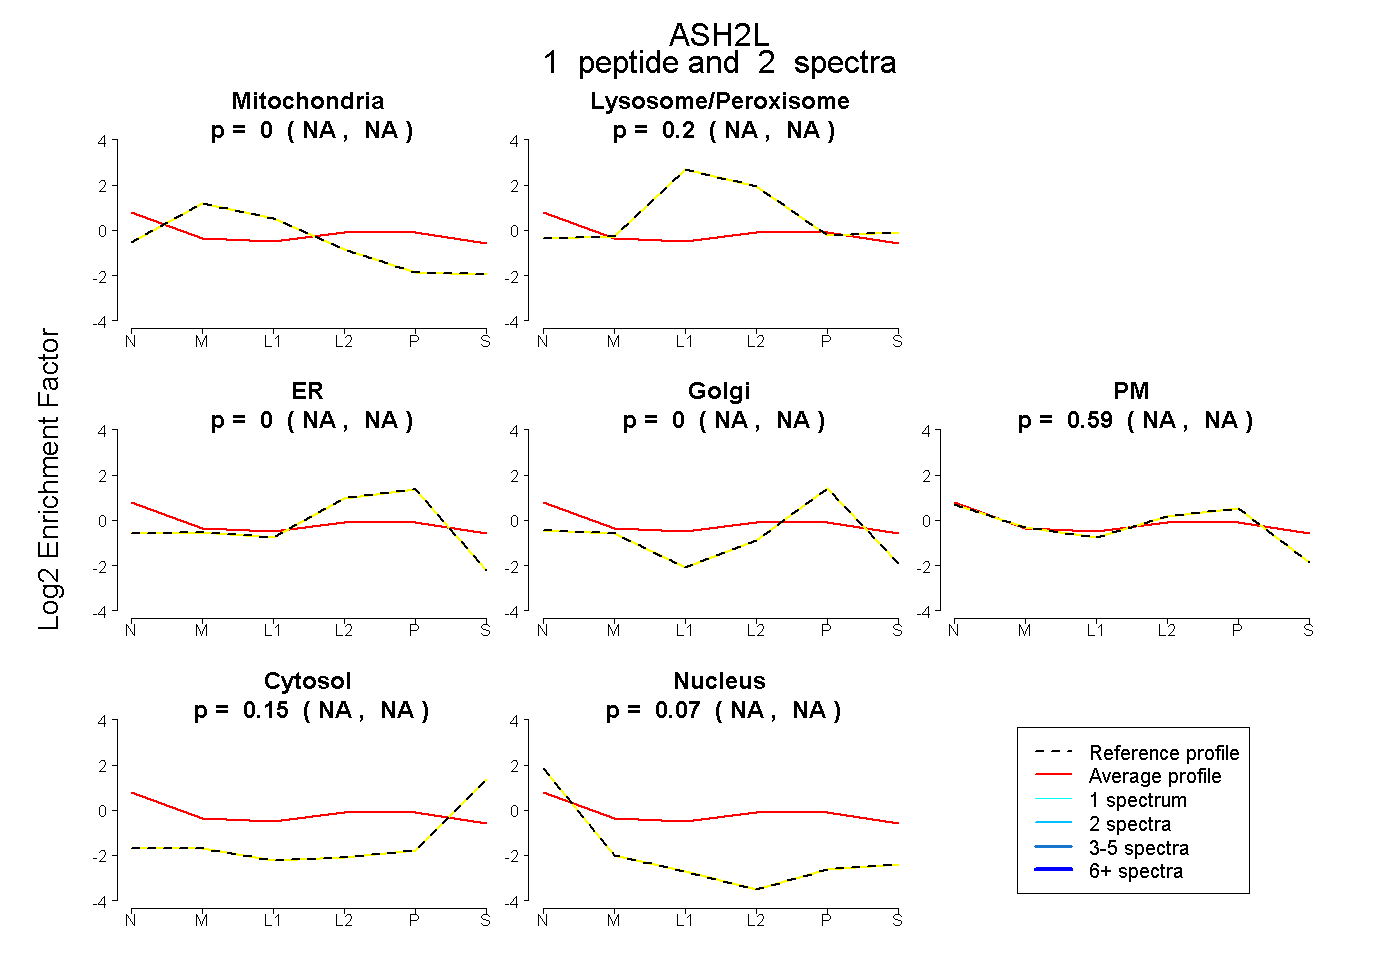
NA | NA
NA | NA
NA | NA
NA | NA
NA | NA
NA | NA
NA | NA
| Plot | Mito | Lyso | Perox | ER | Golgi | PM | Cytosol | Nucleus | |||||
| Expt A |
4 peptides |
8 spectra |
|
0.000 0.000 | 0.121 |
0.000 0.000 | 0.000 |
0.090 0.000 | 0.164 |
0.000 0.000 | 0.114 |
0.038 0.000 | 0.097 |
0.088 0.000 | 0.196 |
0.486 0.433 | 0.542 |
0.297 0.205 | 0.326 |
||
| Plot | Mito | Lyso or Perox | ER | Golgi | PM | Cytosol | Nucleus | ||||||
| Expt B |
1 peptide |
2 spectra |
|
0.000 NA | NA |
0.197 NA | NA |
0.000 NA | NA |
0.000 NA | NA |
0.589 NA | NA |
0.149 NA | NA |
0.066 NA | NA |