 6
6peptides
spectra
0.168 | 0.247
0.000 | 0.000
0.000 | 0.035
0.583 | 0.749
0.000 | 0.112
0.000 | 0.000
0.007 | 0.081
0.000 | 0.018
| Plot | Mito | Lyso | Perox | ER | Golgi | PM | Cytosol | Nucleus | |||||
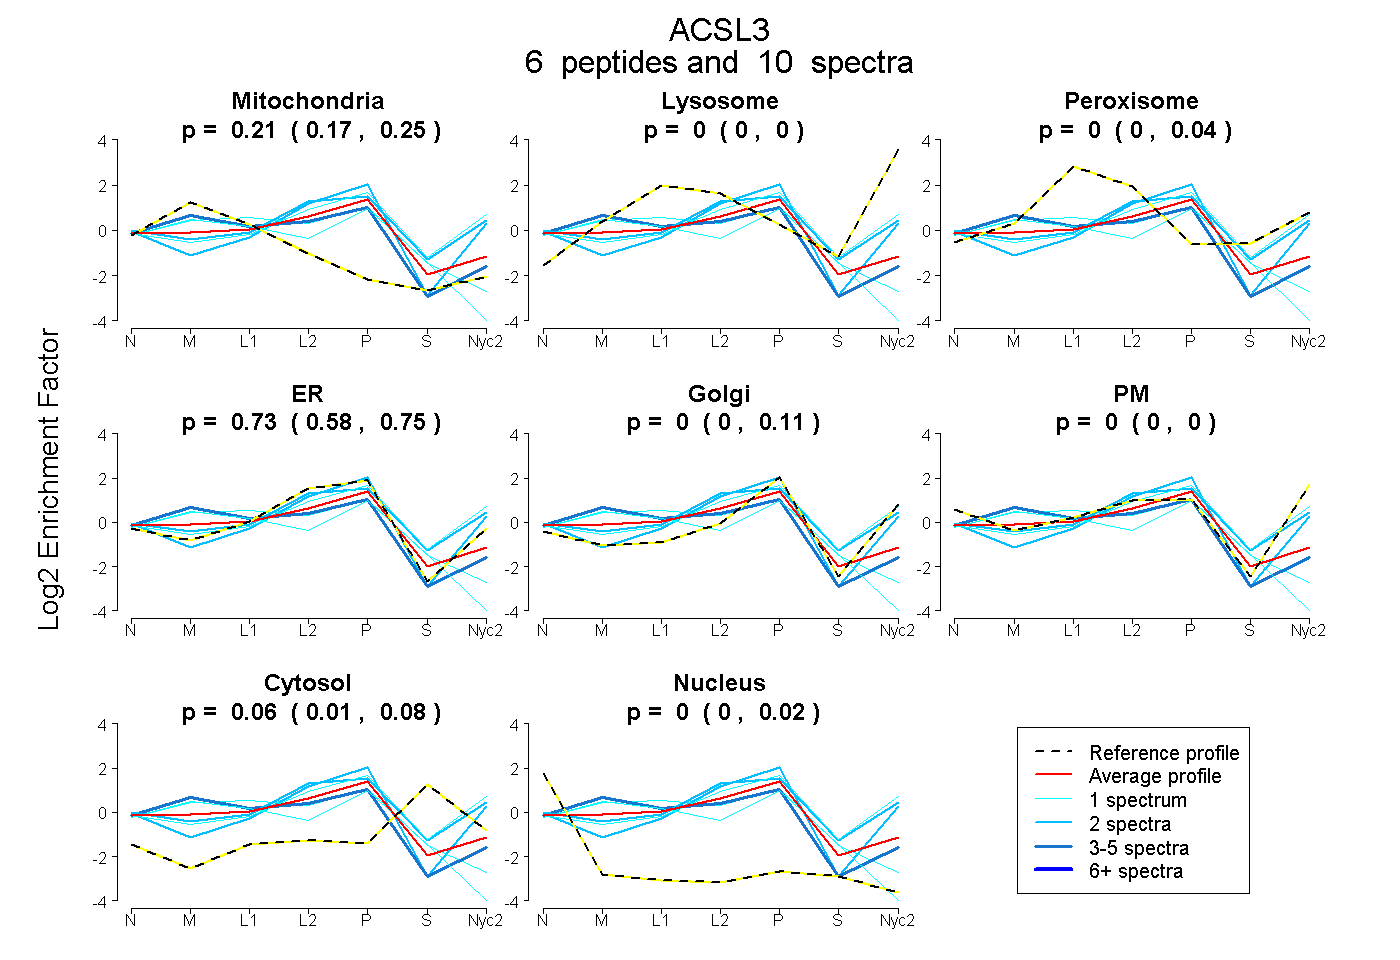
| Expt A |
6 peptides |
10 spectra |
|
0.214 0.168 | 0.247 |
0.000 0.000 | 0.000 |
0.000 0.000 | 0.035 |
0.731 0.583 | 0.749 |
0.000 0.000 | 0.112 |
0.000 0.000 | 0.000 |
0.055 0.007 | 0.081 |
0.000 0.000 | 0.018 |
| 1 spectrum, VFMYAK | 0.000 | 0.067 | 0.099 | 0.269 | 0.344 | 0.131 | 0.090 | 0.000 | ||
| 1 spectrum, ANIAIFCETR | 0.418 | 0.000 | 0.000 | 0.537 | 0.000 | 0.000 | 0.046 | 0.000 | ||
| 2 spectra, LLGGNIR | 0.000 | 0.046 | 0.065 | 0.493 | 0.030 | 0.253 | 0.114 | 0.000 | ||
| 2 spectra, ADFFEDENGQR | 0.000 | 0.000 | 0.000 | 0.647 | 0.281 | 0.072 | 0.000 | 0.000 | ||
| 1 spectrum, GVIVHTMAAVQALGVK | 0.479 | 0.000 | 0.000 | 0.406 | 0.000 | 0.000 | 0.030 | 0.084 | ||
| 3 spectra, GCSTPLCDR | 0.389 | 0.000 | 0.000 | 0.611 | 0.000 | 0.000 | 0.000 | 0.000 |
| Plot | Mito | Lyso or Perox | ER | Golgi | PM | Cytosol | Nucleus | ||||||
| Expt B |
2 peptides |
2 spectra |
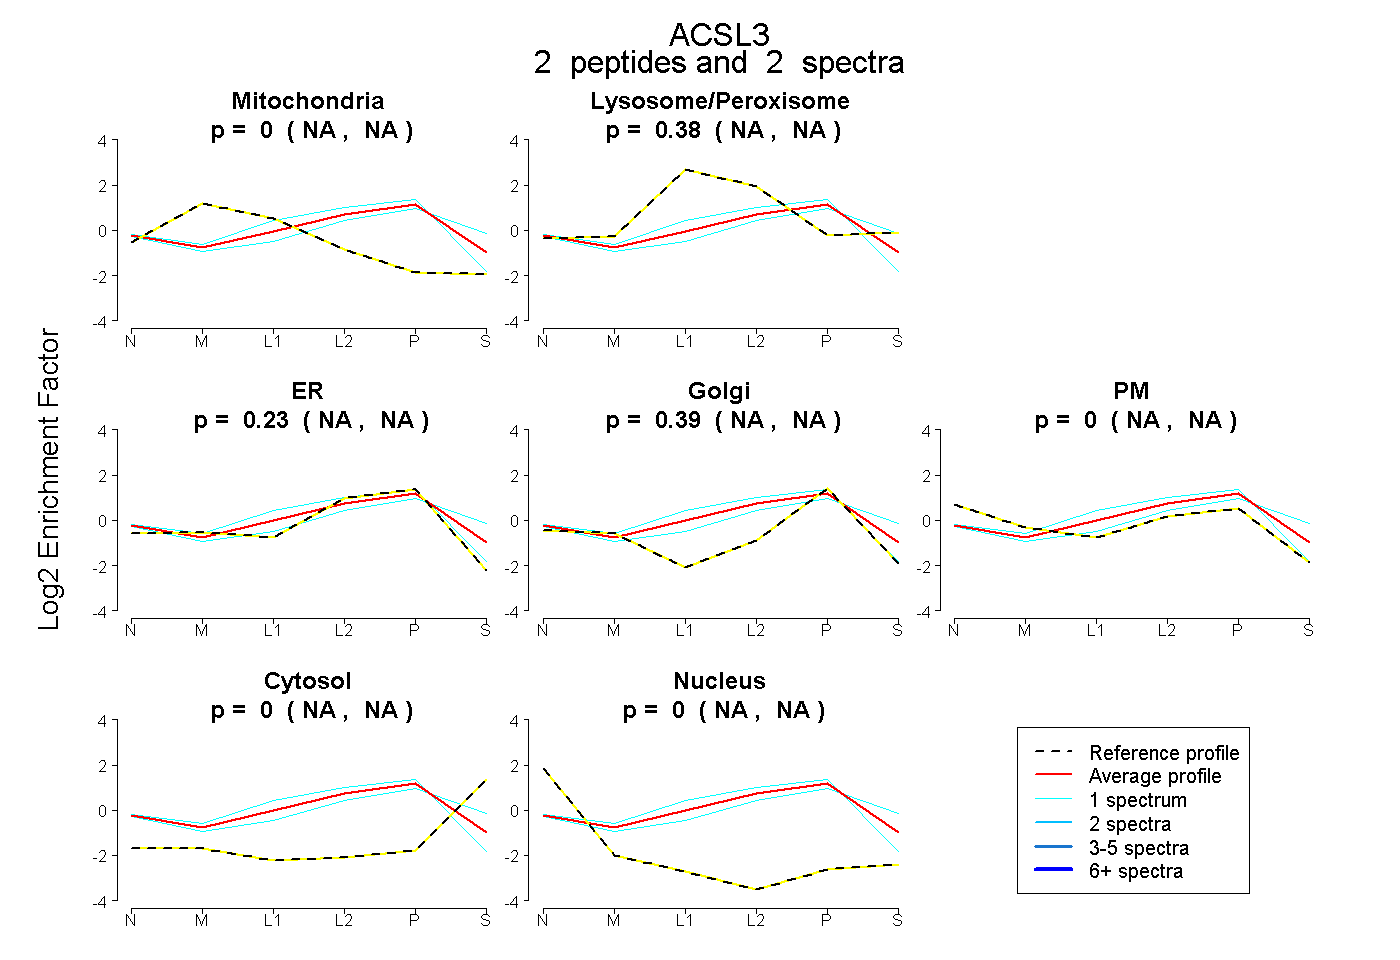 |
0.000 NA | NA |
0.376 NA | NA |
0.230 NA | NA |
0.395 NA | NA |
0.000 NA | NA |
0.000 NA | NA |
0.000 NA | NA |
|||
| Plot | Lyso | Other | |||||||||||
| Expt C |
8 peptides |
10 spectra |
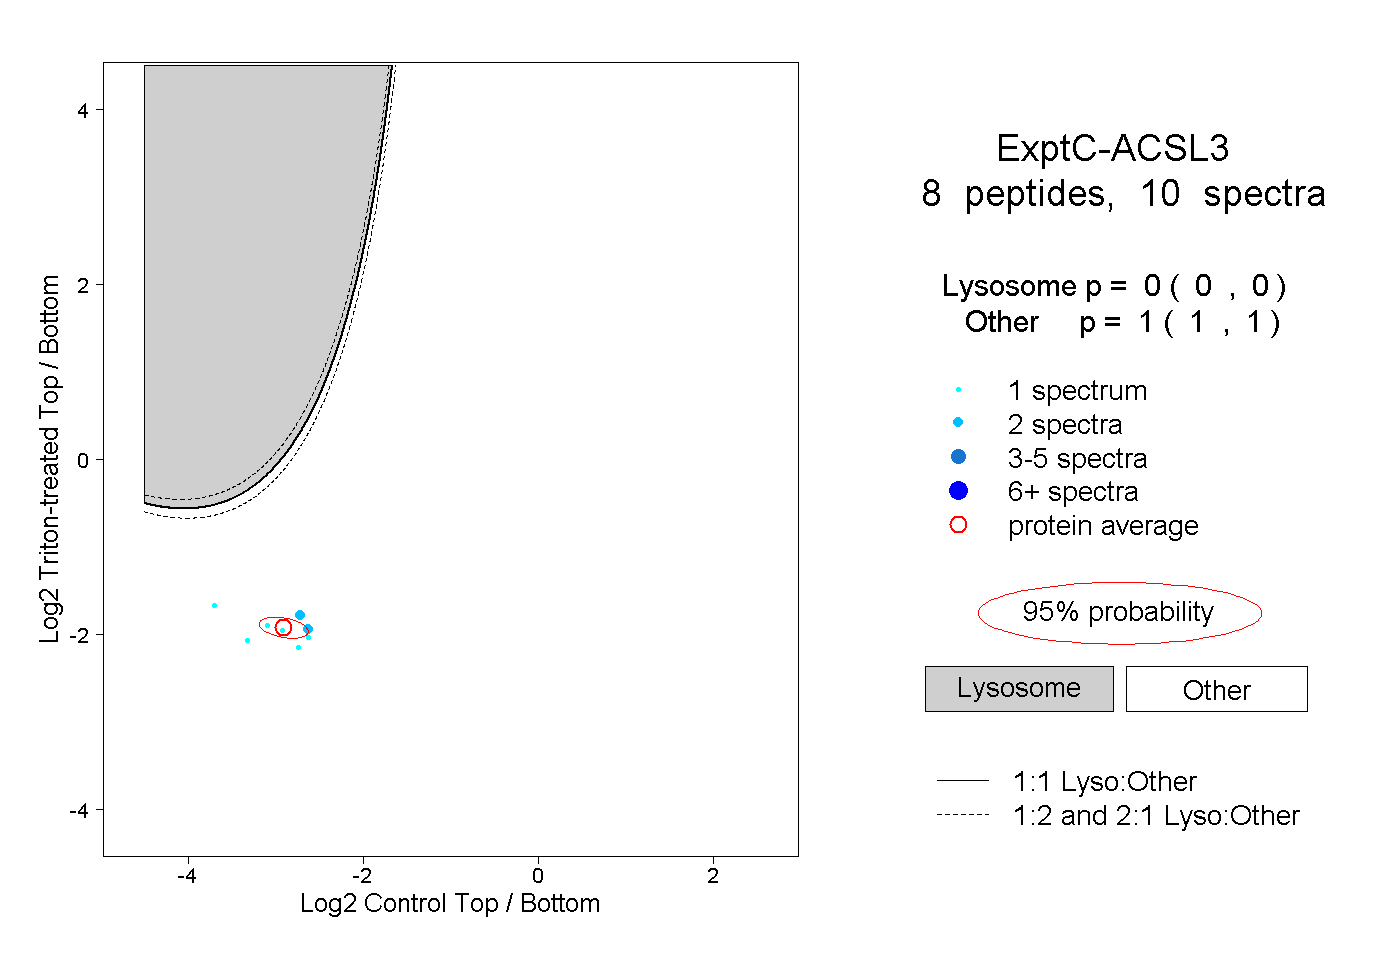 |
0.000 0.000 | 0.000 |
1.000 1.000 | 1.000 |
||||||||
| Plot | Lyso | Other | |||||||||||
| Expt D |
2 peptides |
4 spectra |
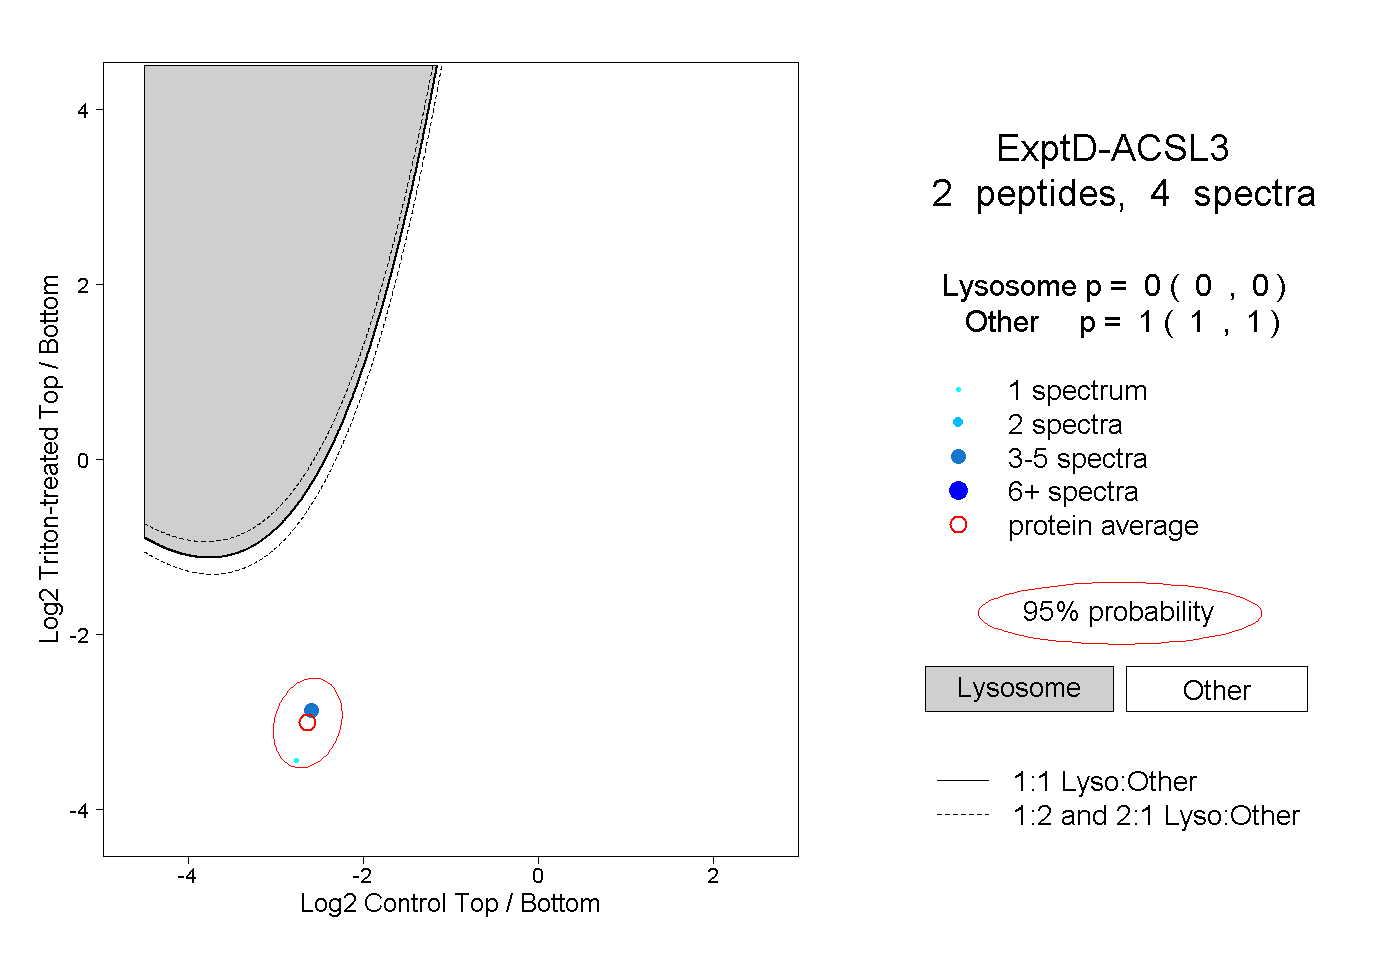 |
0.000 0.000 | 0.000 |
1.000 1.000 | 1.000 |