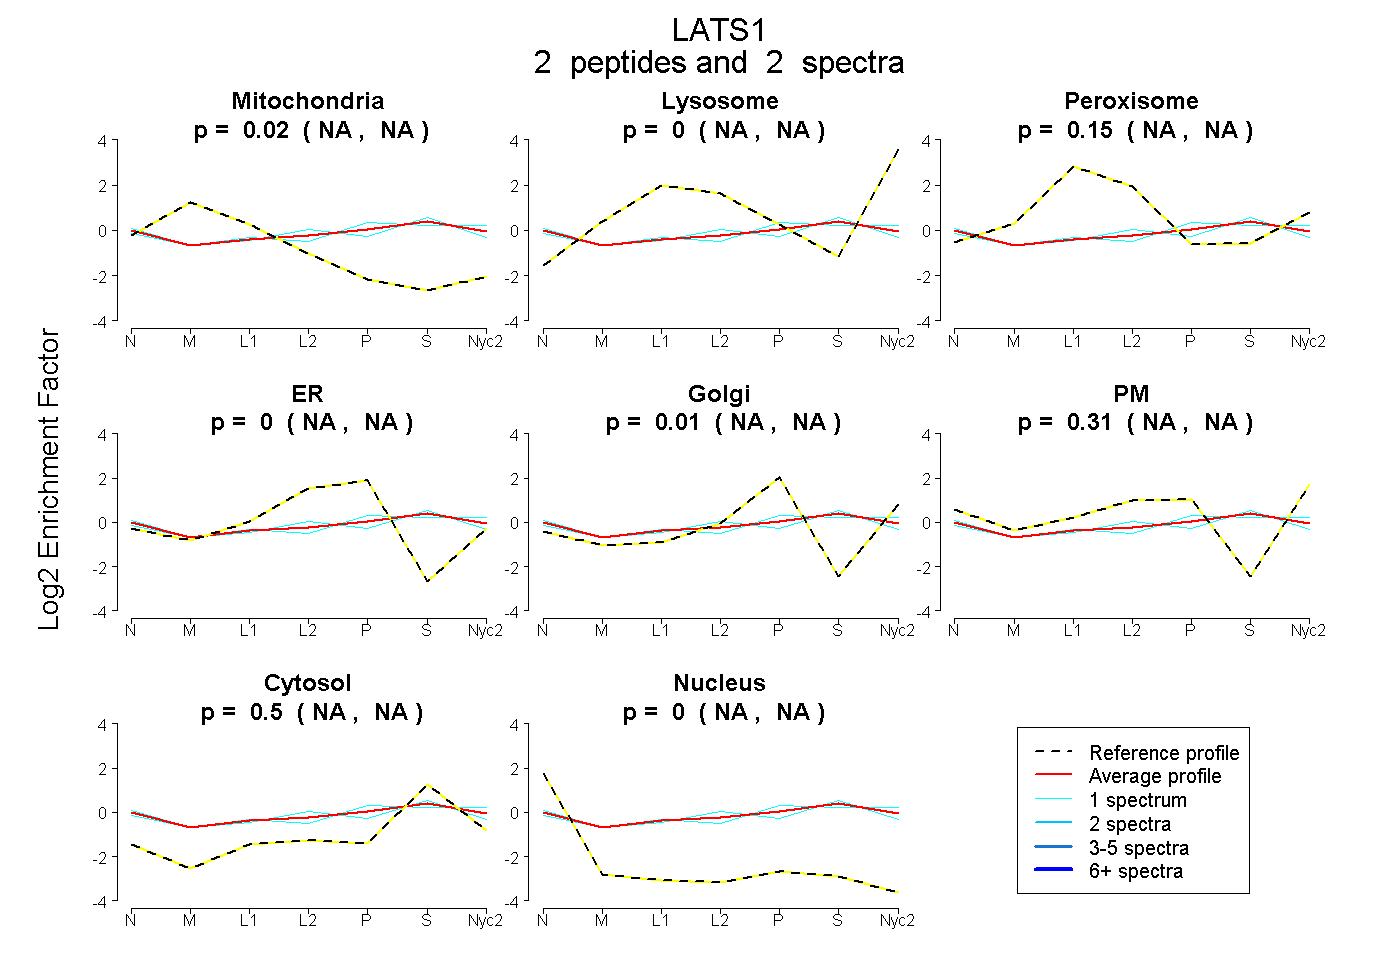
 2
2peptides
spectra
NA | NA
NA | NA
NA | NA
NA | NA
NA | NA
NA | NA
NA | NA
NA | NA
| Plot | Mito | Lyso | Perox | ER | Golgi | PM | Cytosol | Nucleus | |||||
| Expt A |
2 peptides |
2 spectra |
|
0.024 NA | NA |
0.000 NA | NA |
0.147 NA | NA |
0.000 NA | NA |
0.015 NA | NA |
0.313 NA | NA |
0.501 NA | NA |
0.000 NA | NA |
| 1 spectrum, ESNYIR | 0.005 | 0.000 | 0.110 | 0.000 | 0.076 | 0.343 | 0.466 | 0.000 | ||
| 1 spectrum, DILAEADNEWVVR | 0.039 | 0.000 | 0.201 | 0.041 | 0.000 | 0.196 | 0.523 | 0.000 |
| Plot | Lyso | Other | |||||||||||
| Expt C |
1 peptide |
1 spectrum |
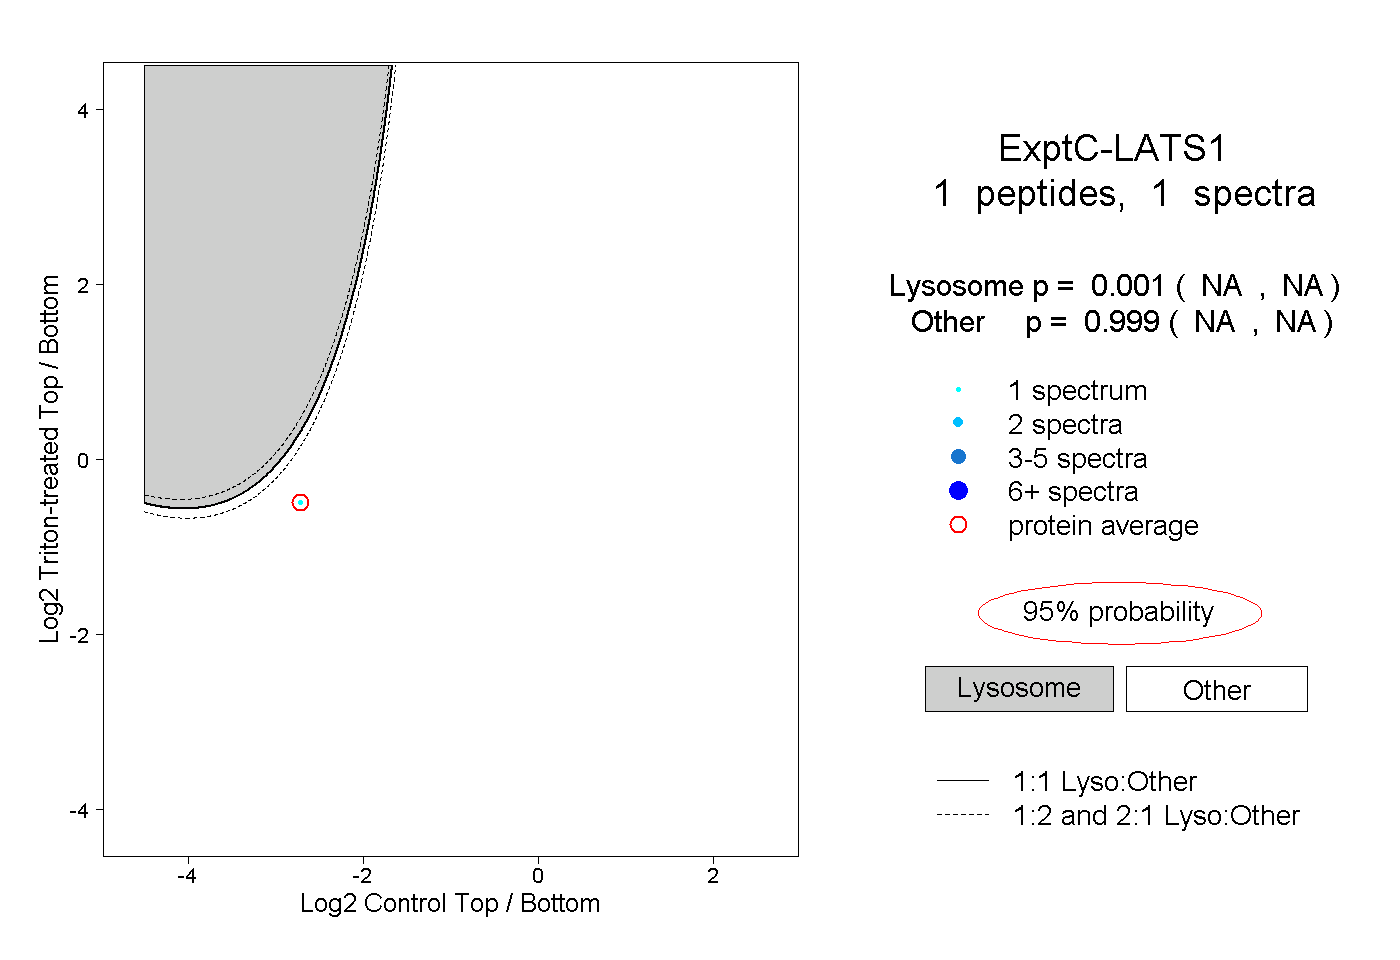 |
0.001 NA | NA |
0.999 NA | NA |