6
6peptides
spectra
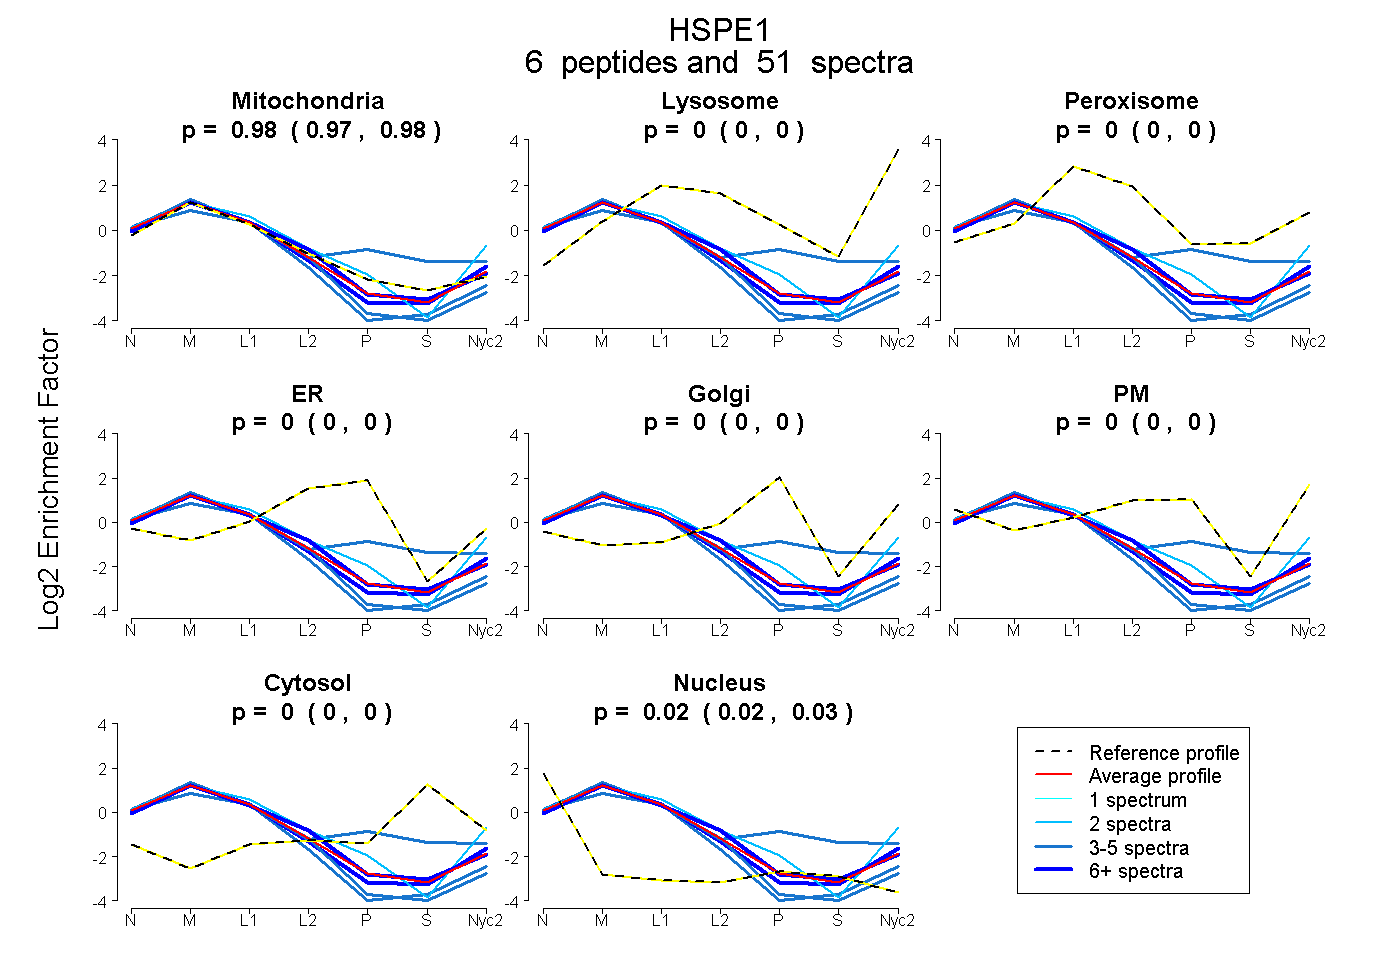
0.971 | 0.979
0.000 | 0.000
0.000 | 0.000
0.000 | 0.000
0.000 | 0.000
0.000 | 0.000
0.000 | 0.000
0.020 | 0.029
7peptides
spectra
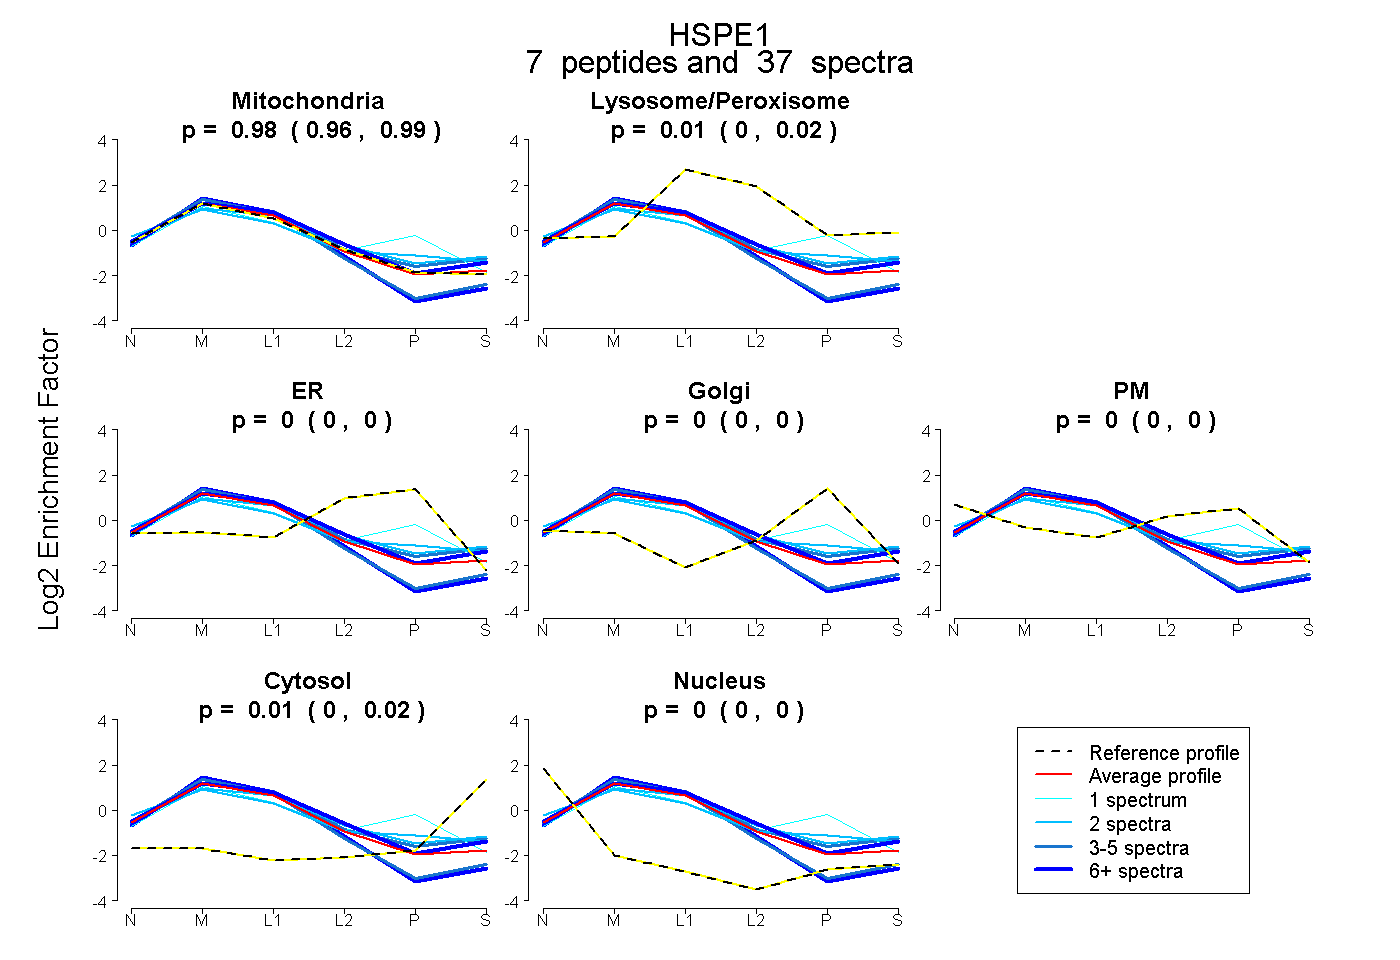
0.961 | 0.993
0.000 | 0.021
0.000 | 0.000
0.000 | 0.000
0.000 | 0.000
0.001 | 0.019
0.000 | 0.000
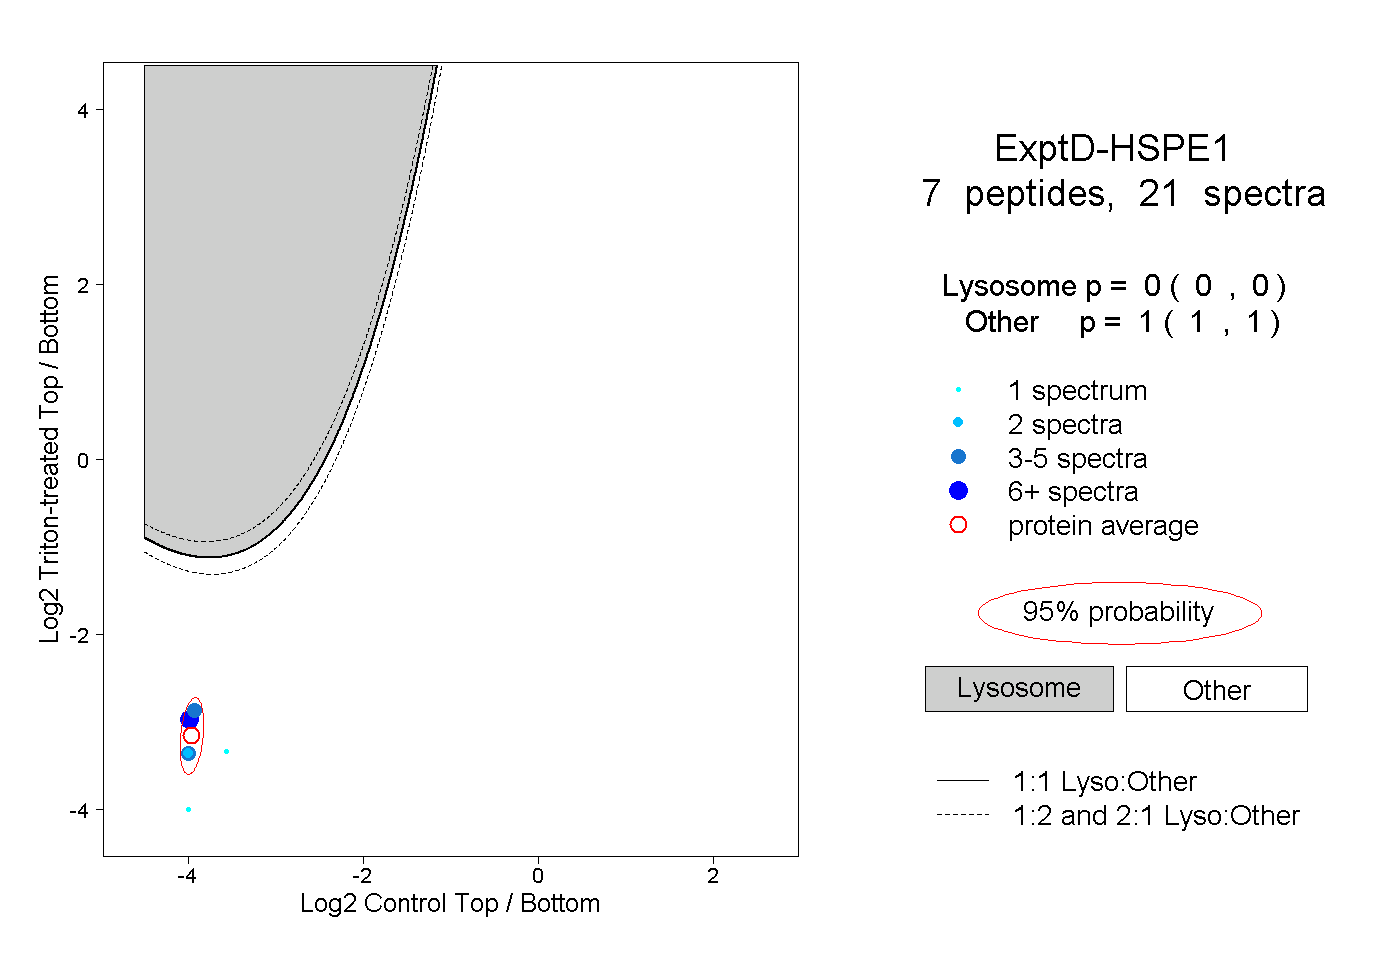
8peptides
spectra
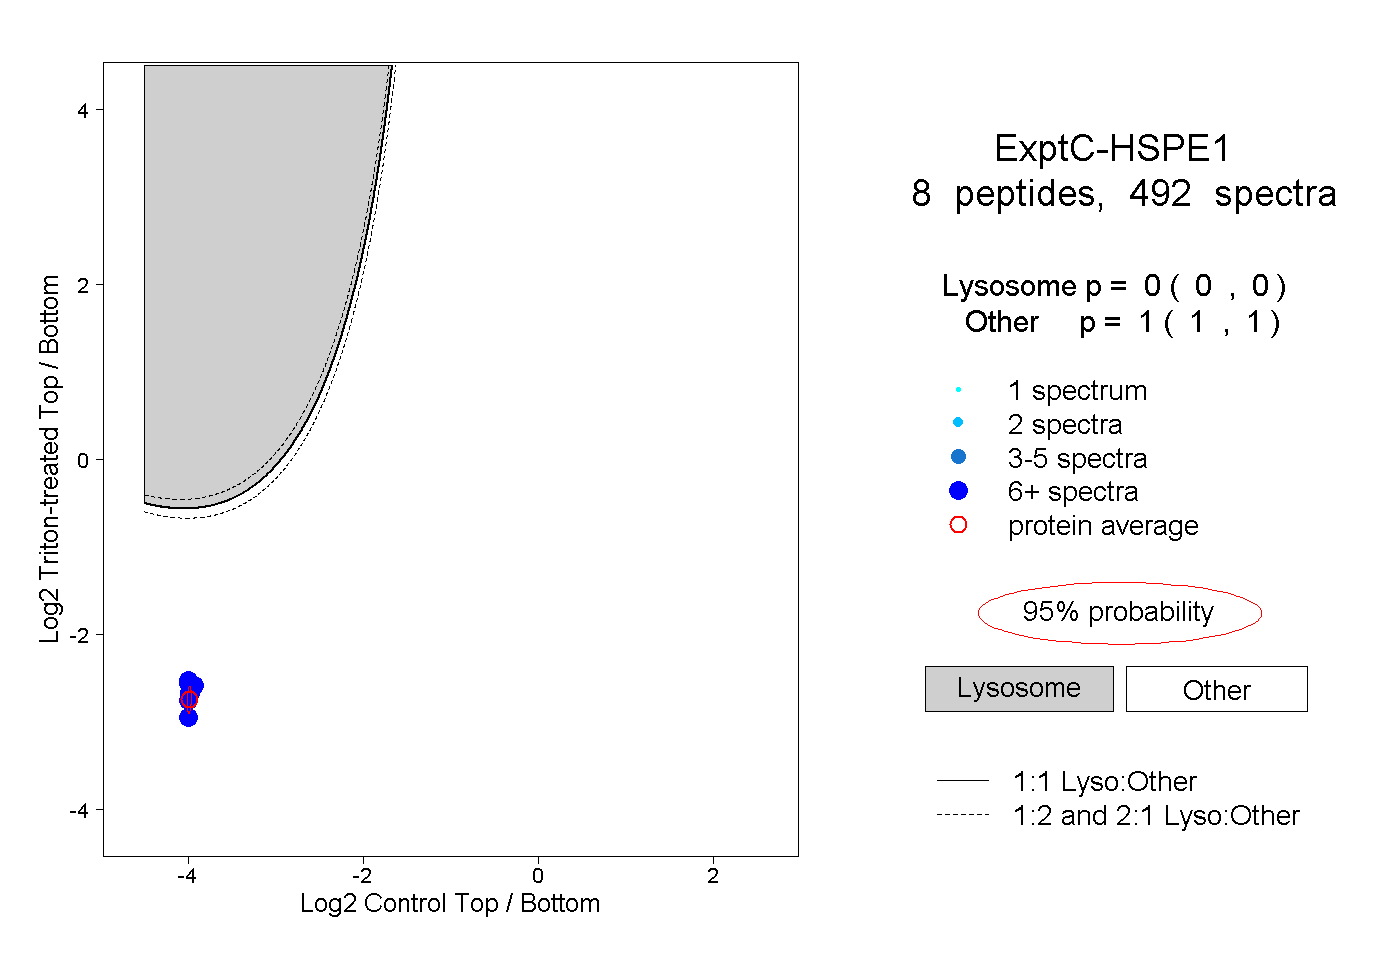
0.000 | 0.000
1.000 | 1.000