 6
6peptides
spectra
0.971 | 0.979
0.000 | 0.000
0.000 | 0.000
0.000 | 0.000
0.000 | 0.000
0.000 | 0.000
0.000 | 0.000
0.020 | 0.029
| Plot | Mito | Lyso | Perox | ER | Golgi | PM | Cytosol | Nucleus | |||||
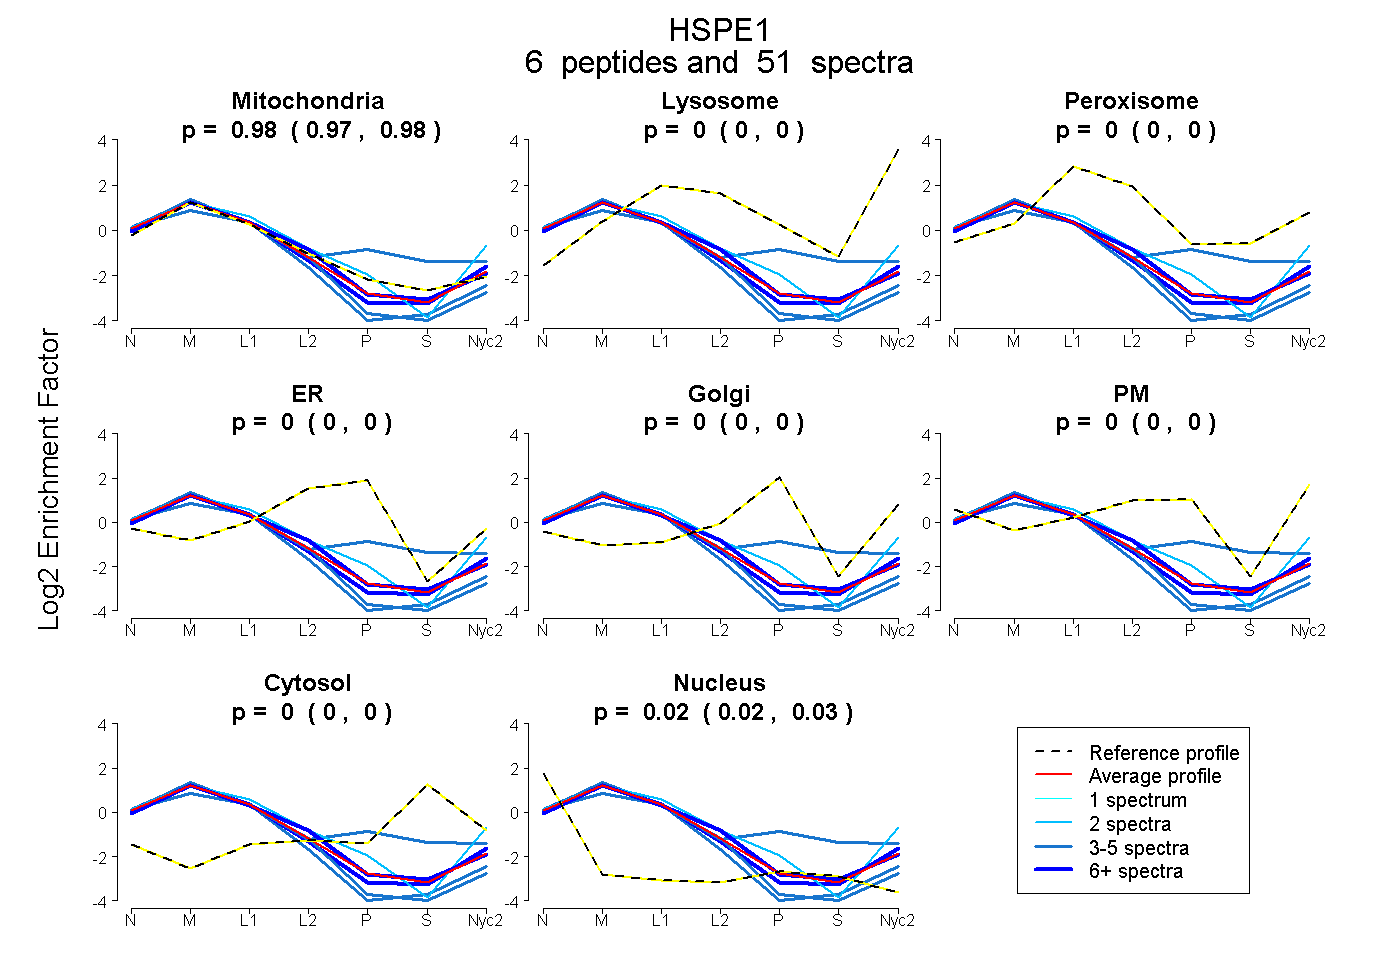
| Expt A |
6 peptides |
51 spectra |
|
0.975 0.971 | 0.979 |
0.000 0.000 | 0.000 |
0.000 0.000 | 0.000 |
0.000 0.000 | 0.000 |
0.000 0.000 | 0.000 |
0.000 0.000 | 0.000 |
0.000 0.000 | 0.000 |
0.025 0.020 | 0.029 |
| 2 spectra, VLLPEYGGTK | 0.799 | 0.006 | 0.000 | 0.000 | 0.000 | 0.196 | 0.000 | 0.000 | ||
| 4 spectra, GGIMLPEK | 0.656 | 0.000 | 0.088 | 0.000 | 0.138 | 0.000 | 0.118 | 0.000 | ||
| 4 spectra, GGEIQPVSVK | 0.934 | 0.000 | 0.000 | 0.000 | 0.000 | 0.000 | 0.000 | 0.066 | ||
| 6 spectra, VLQATVVAVGSGGK | 1.000 | 0.000 | 0.000 | 0.000 | 0.000 | 0.000 | 0.000 | 0.000 | ||
| 5 spectra, DGDILGK | 0.914 | 0.000 | 0.000 | 0.000 | 0.000 | 0.000 | 0.000 | 0.086 | ||
| 30 spectra, FLPLFDR | 0.979 | 0.000 | 0.000 | 0.000 | 0.000 | 0.000 | 0.000 | 0.021 |
| Plot | Mito | Lyso or Perox | ER | Golgi | PM | Cytosol | Nucleus | ||||||
| Expt B |
7 peptides |
37 spectra |
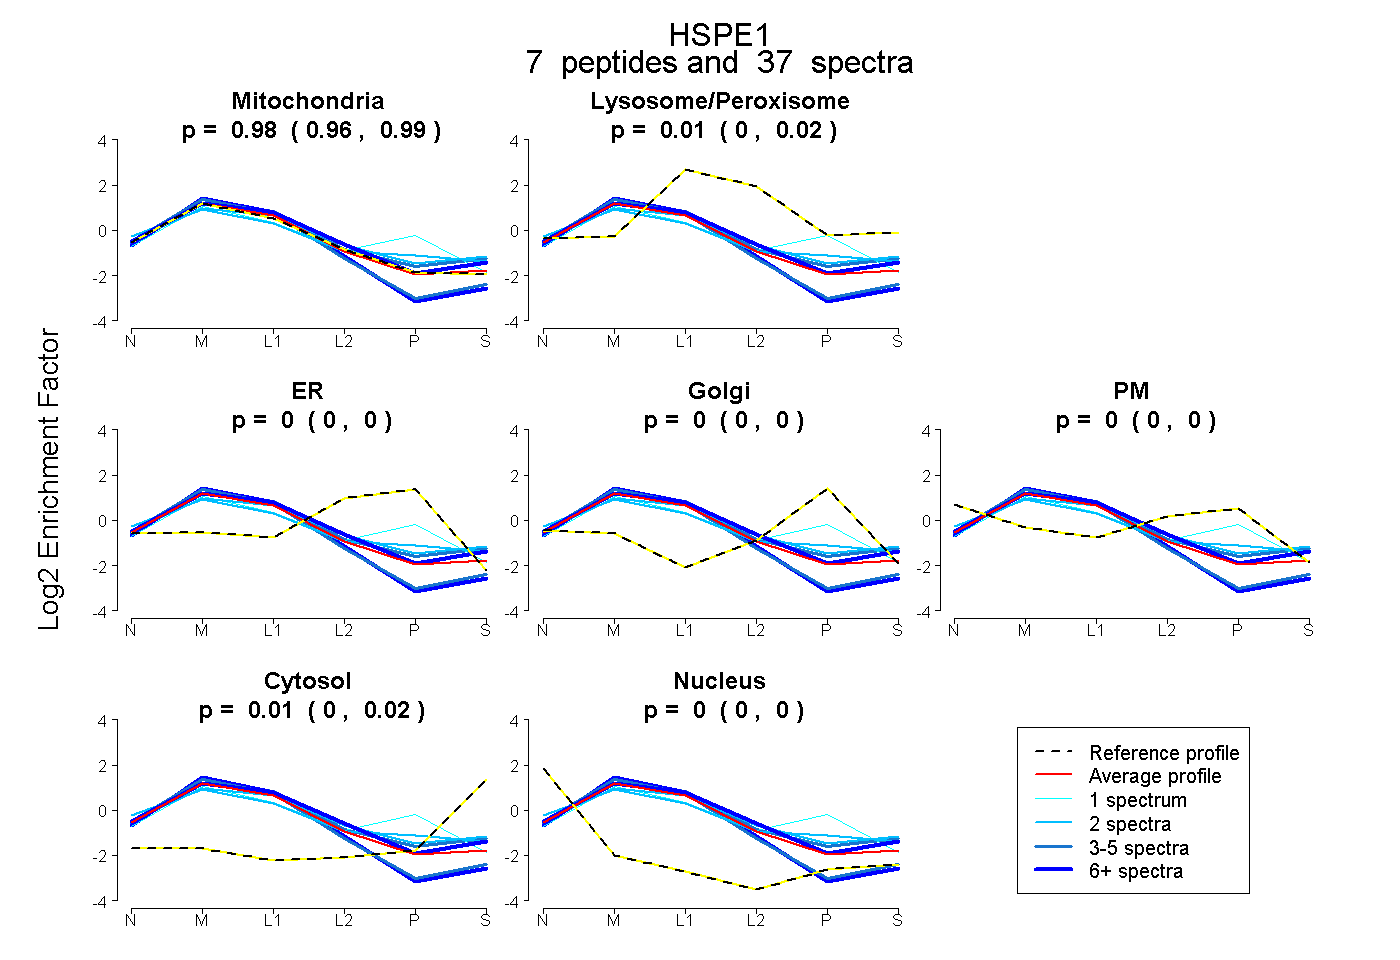 |
0.978 0.961 | 0.993 |
0.010 0.000 | 0.021 |
0.000 0.000 | 0.000 |
0.000 0.000 | 0.000 |
0.000 0.000 | 0.000 |
0.012 0.001 | 0.019 |
0.000 0.000 | 0.000 |
|||
| Plot | Lyso | Other | |||||||||||
| Expt C |
8 peptides |
492 spectra |
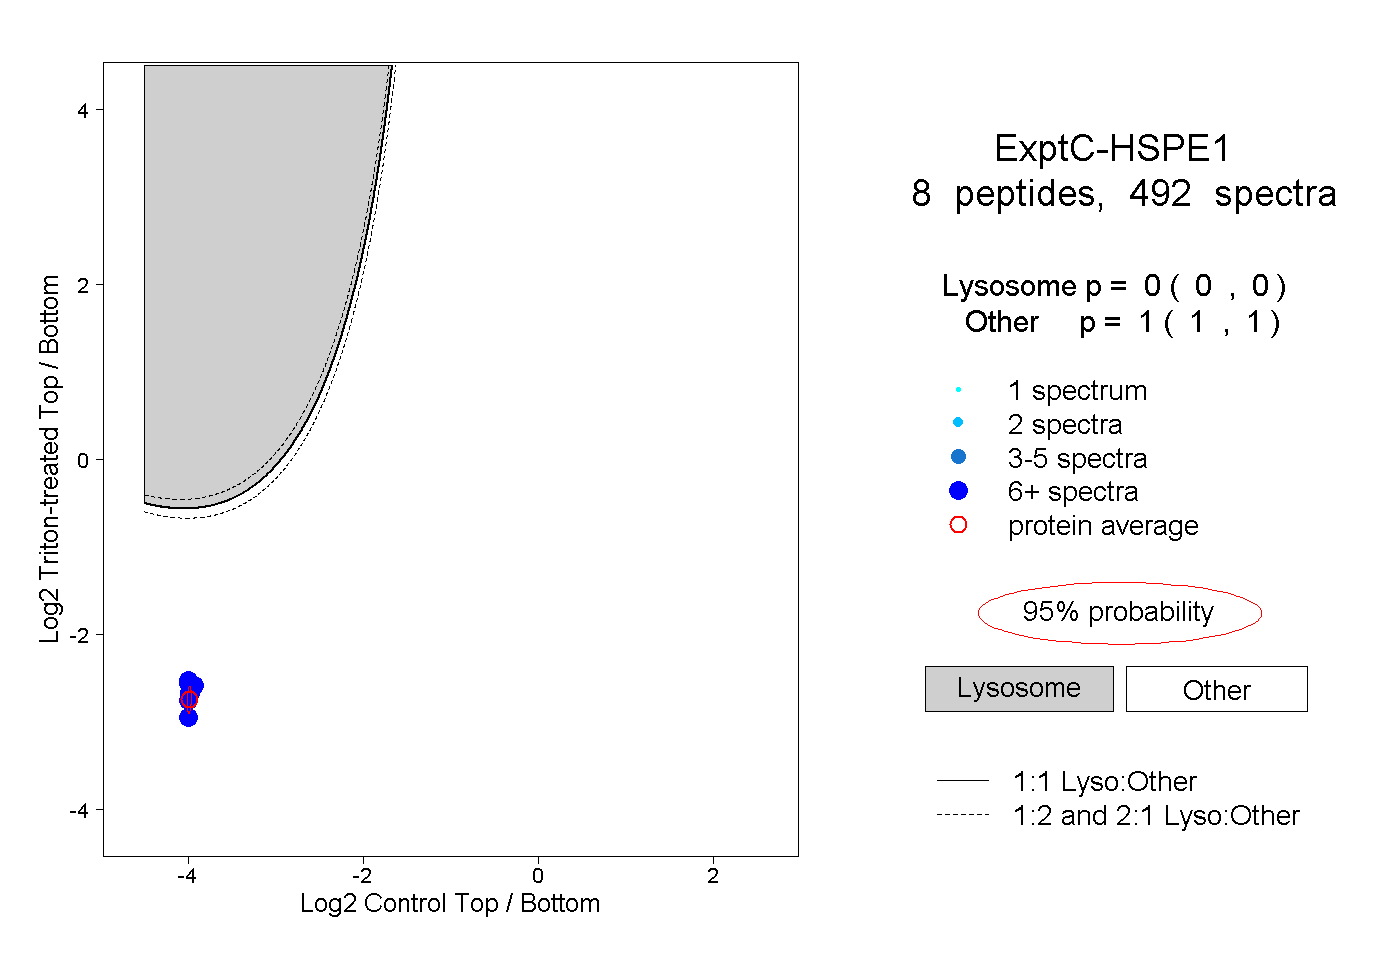 |
0.000 0.000 | 0.000 |
1.000 1.000 | 1.000 |
||||||||
| Plot | Lyso | Other | |||||||||||
| Expt D |
7 peptides |
21 spectra |
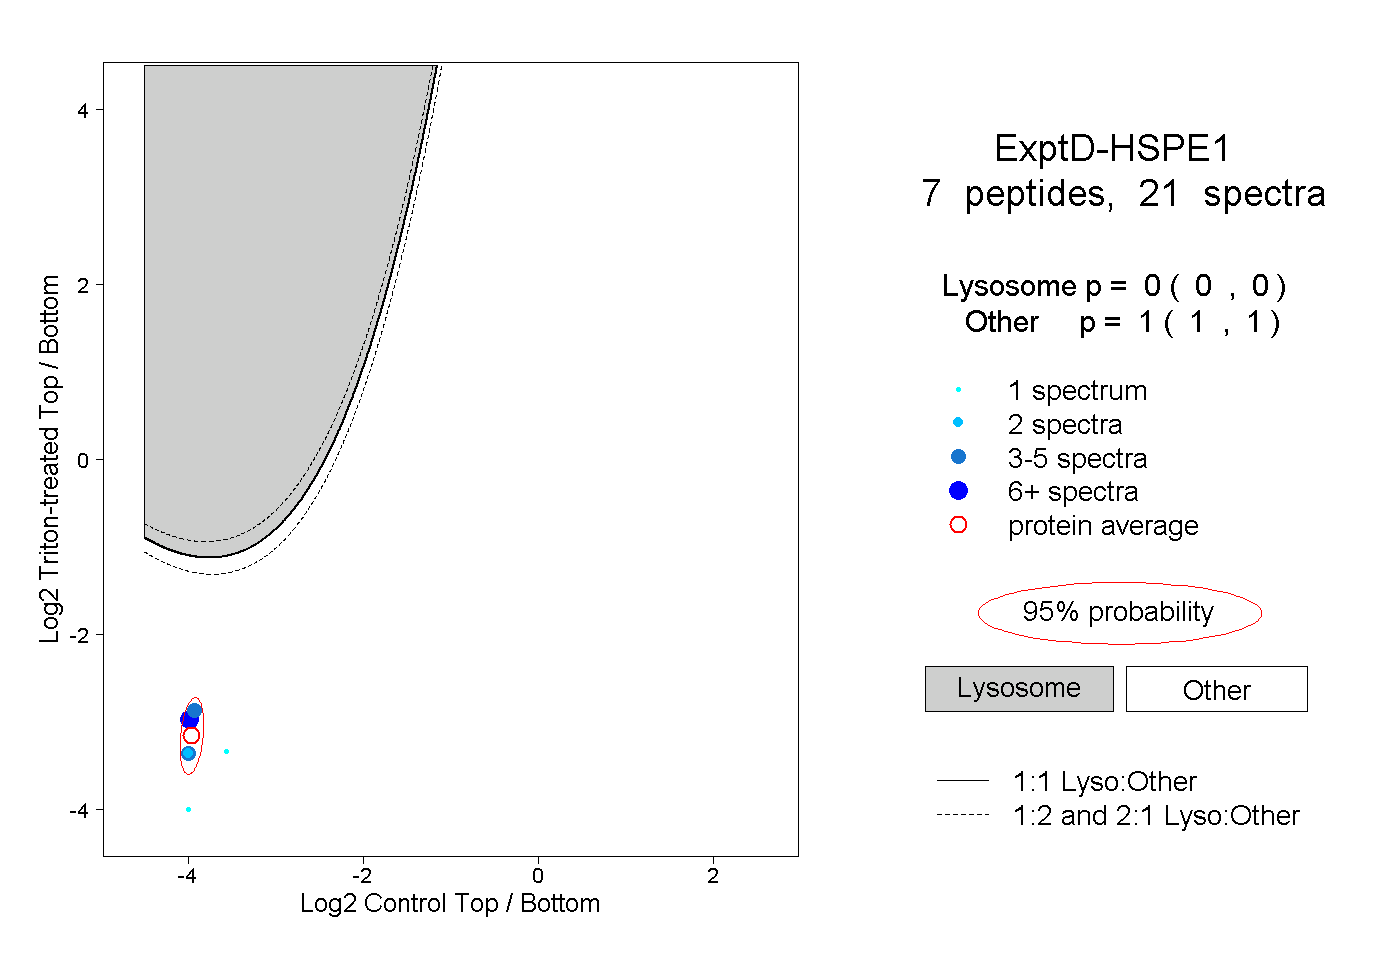 |
0.000 0.000 | 0.000 |
1.000 1.000 | 1.000 |