 25
25peptides
spectra
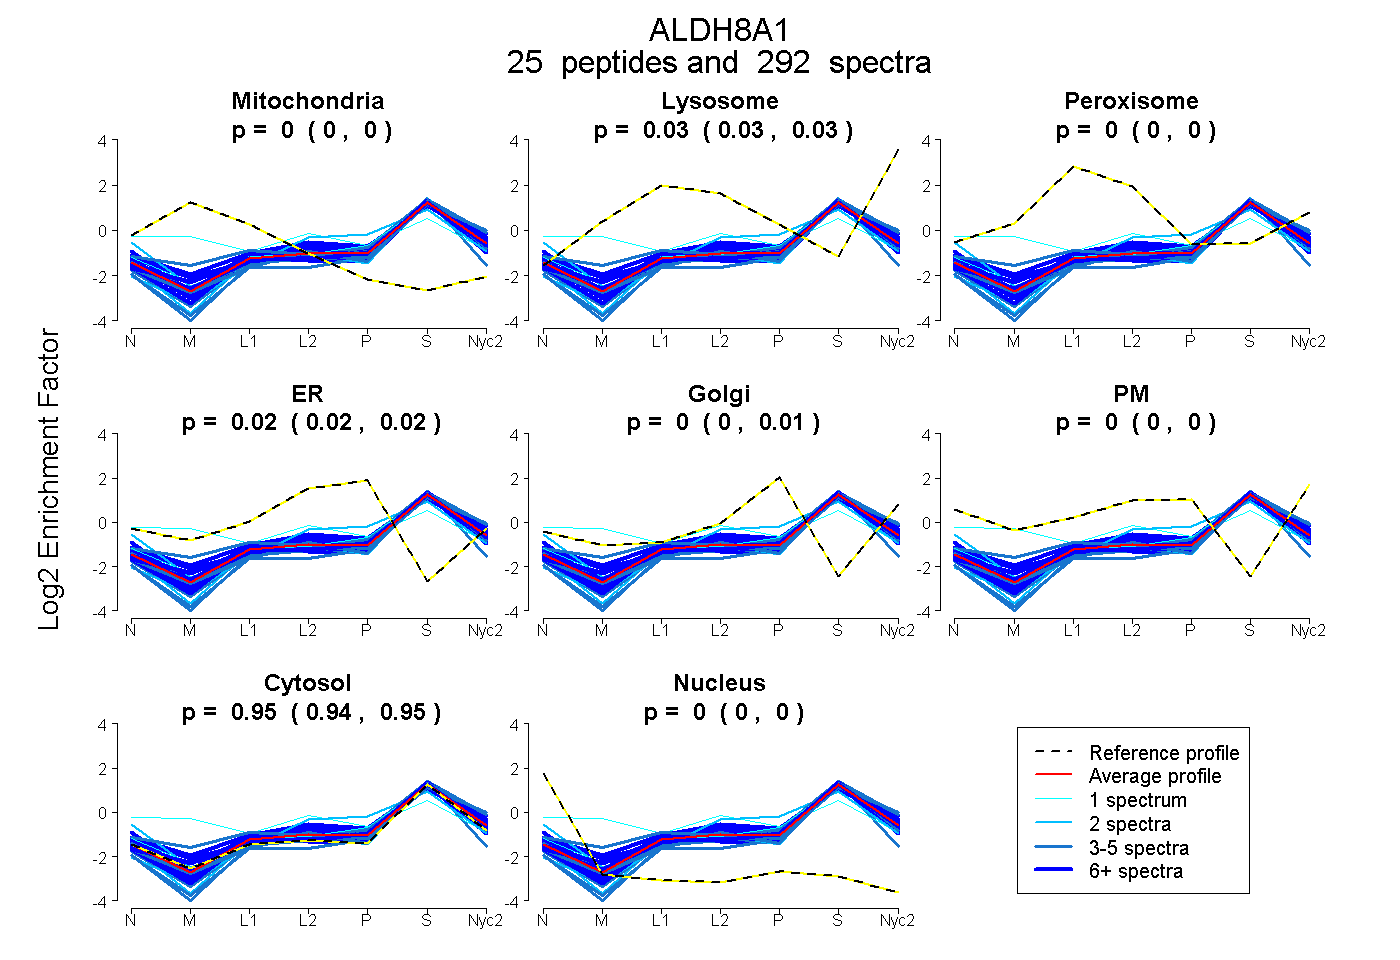
0.000 | 0.000
0.032 | 0.035
0.000 | 0.000
0.015 | 0.020
0.000 | 0.006
0.000 | 0.000
0.944 | 0.946
0.000 | 0.000
20peptides
spectra
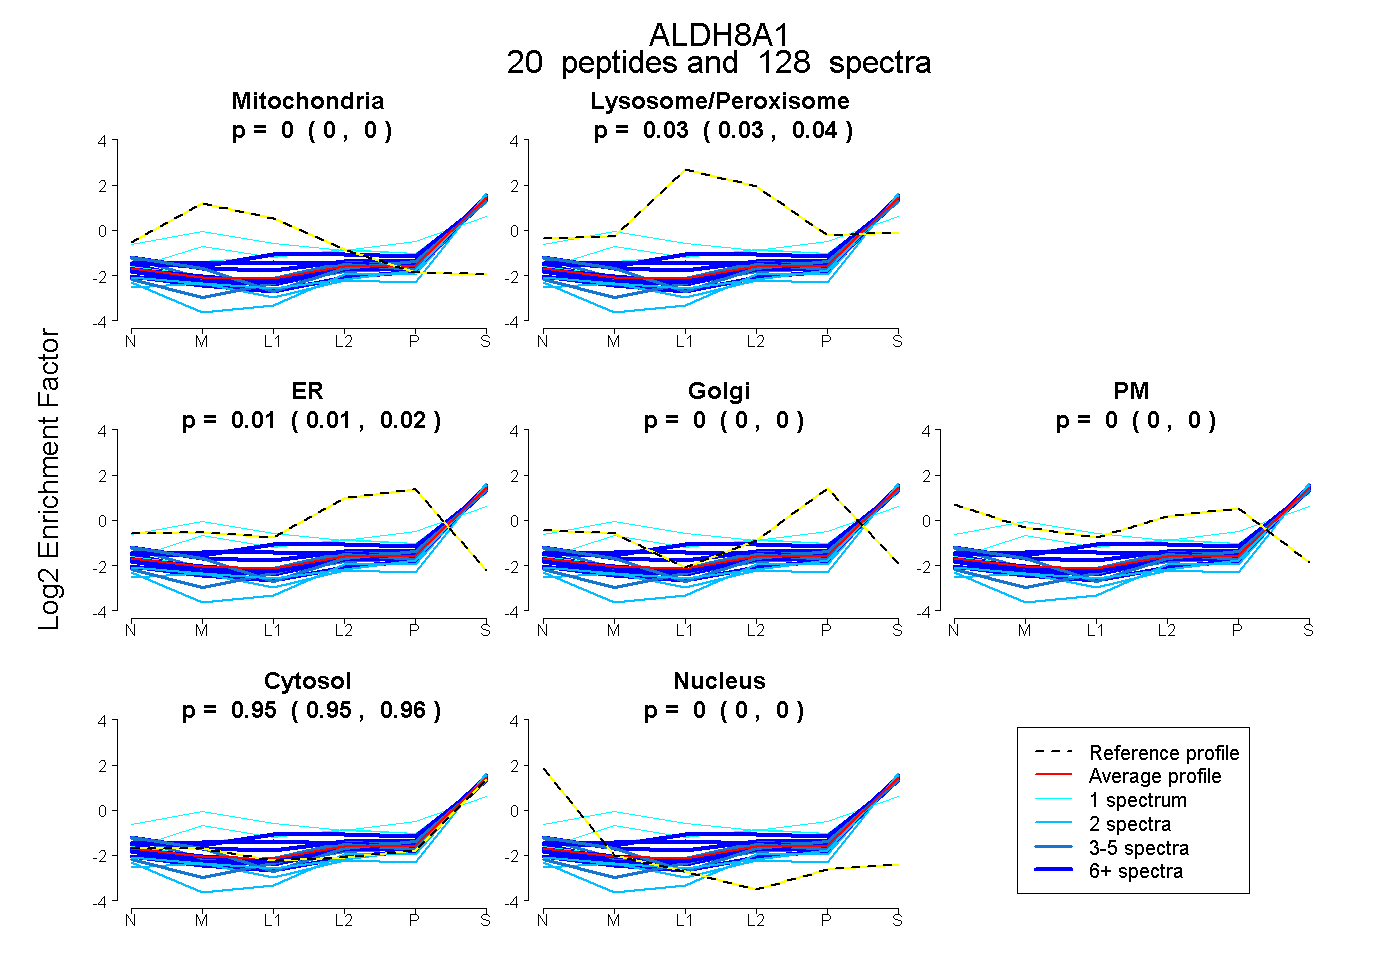
0.000 | 0.000
0.027 | 0.035
0.010 | 0.016
0.000 | 0.000
0.000 | 0.000
0.953 | 0.957
0.000 | 0.000
24peptides
spectra
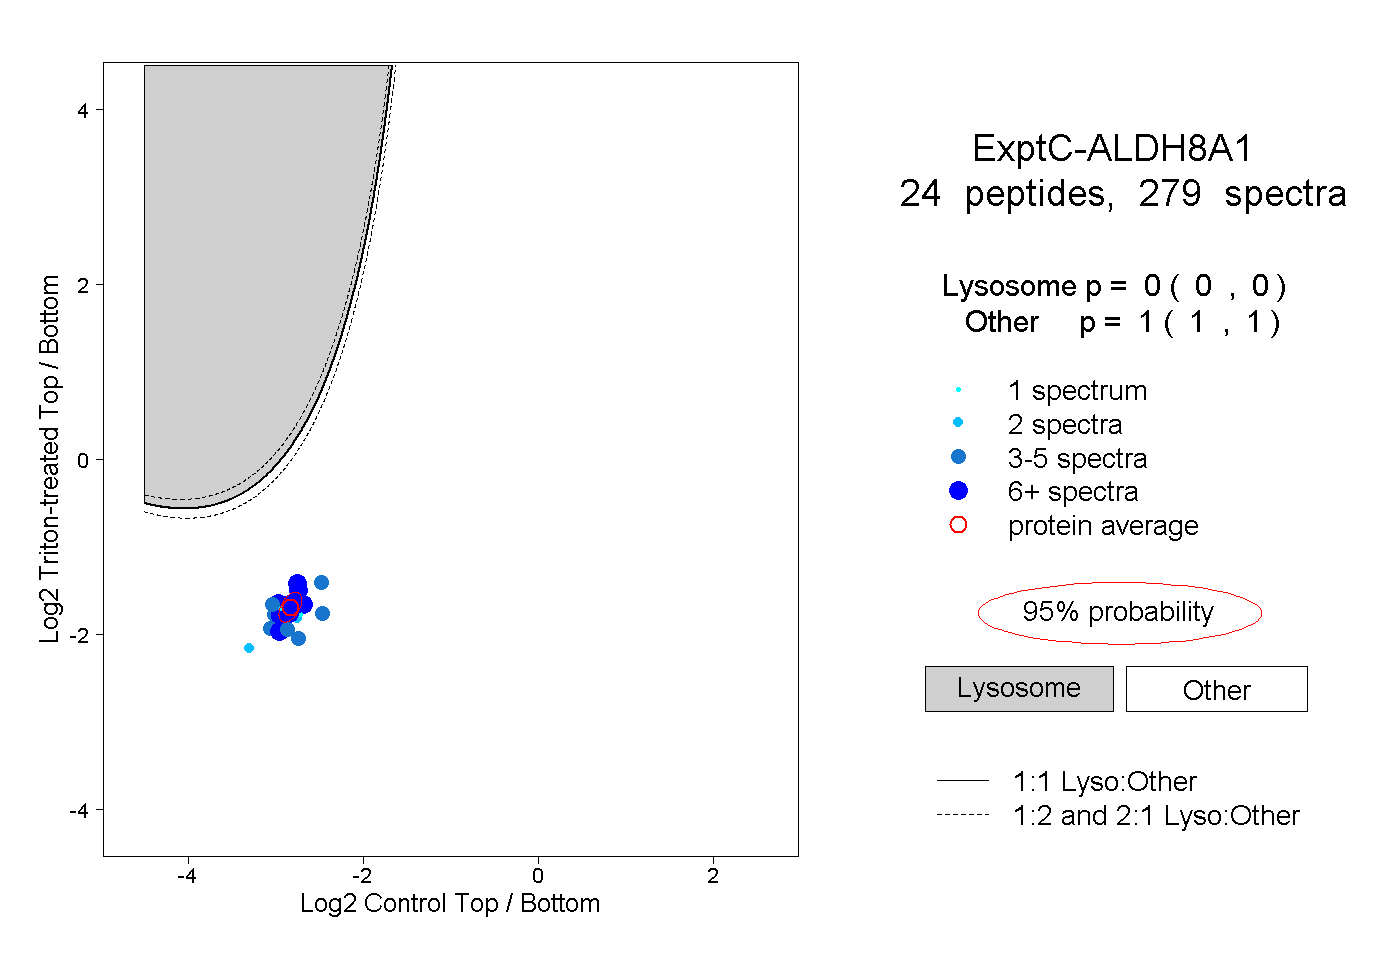
0.000 | 0.000
1.000 | 1.000
13peptides
spectra
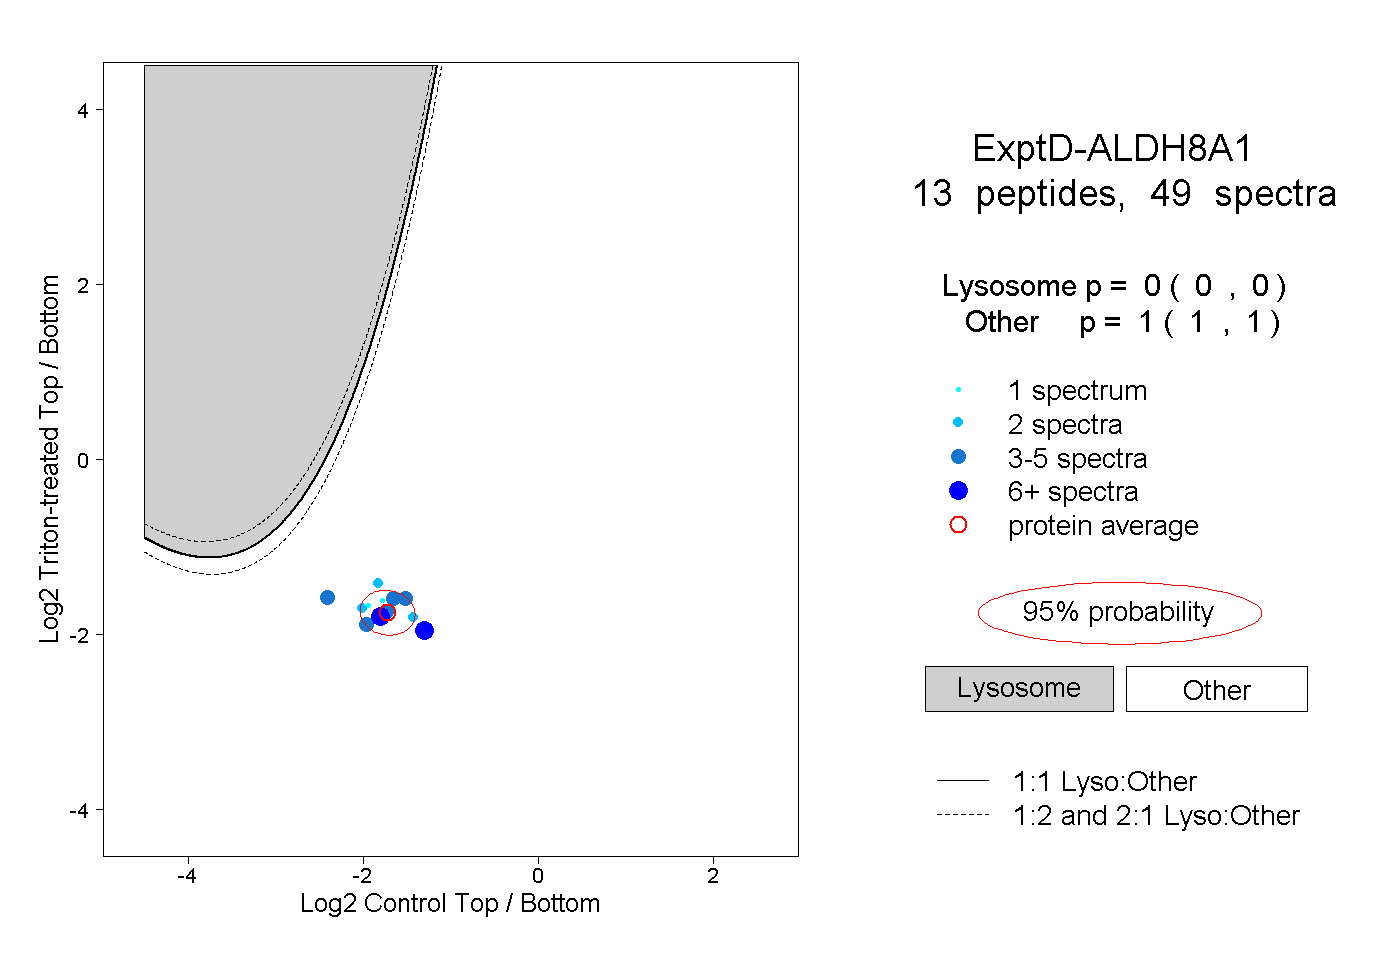
0.000 | 0.000
1.000 | 1.000