 5
5peptides
spectra
0.000 | 0.000
0.628 | 0.695
0.000 | 0.000
0.000 | 0.000
0.000 | 0.000
0.000 | 0.000
0.299 | 0.367
0.000 | 0.000
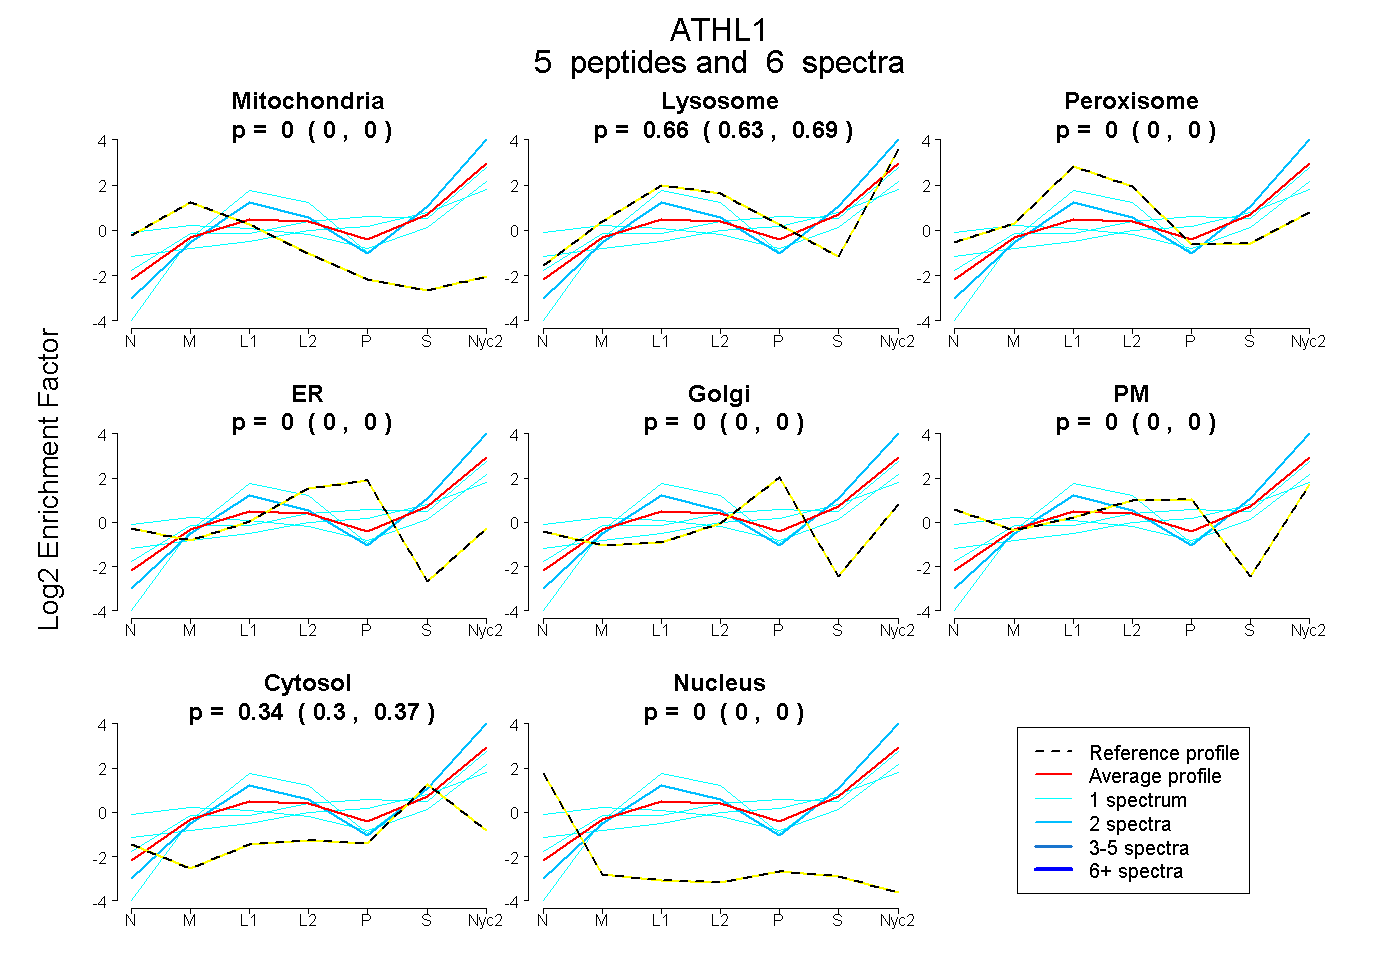
| Plot | Mito | Lyso | Perox | ER | Golgi | PM | Cytosol | Nucleus | |||||
| Expt A |
5 peptides |
6 spectra |
|
0.000 0.000 | 0.000 |
0.664 0.628 | 0.695 |
0.000 0.000 | 0.000 |
0.000 0.000 | 0.000 |
0.000 0.000 | 0.000 |
0.000 0.000 | 0.000 |
0.336 0.299 | 0.367 |
0.000 0.000 | 0.000 |
| 2 spectra, VPFDSEQNFHPEFDGYER | 0.000 | 0.755 | 0.000 | 0.000 | 0.000 | 0.000 | 0.245 | 0.000 | ||
| 1 spectrum, LTTGNEPITVPLR | 0.055 | 0.533 | 0.000 | 0.000 | 0.000 | 0.063 | 0.302 | 0.046 | ||
| 1 spectrum, LNFAFSK | 0.000 | 0.631 | 0.000 | 0.000 | 0.048 | 0.000 | 0.321 | 0.000 | ||
| 1 spectrum, ITAAGVTFDPLCPDLVSK | 0.000 | 0.437 | 0.000 | 0.000 | 0.077 | 0.000 | 0.486 | 0.000 | ||
| 1 spectrum, NAQNLGYQGAK | 0.000 | 0.835 | 0.000 | 0.000 | 0.000 | 0.000 | 0.165 | 0.000 |
| Plot | Lyso | Other | |||||||||||
| Expt C |
7 peptides |
20 spectra |
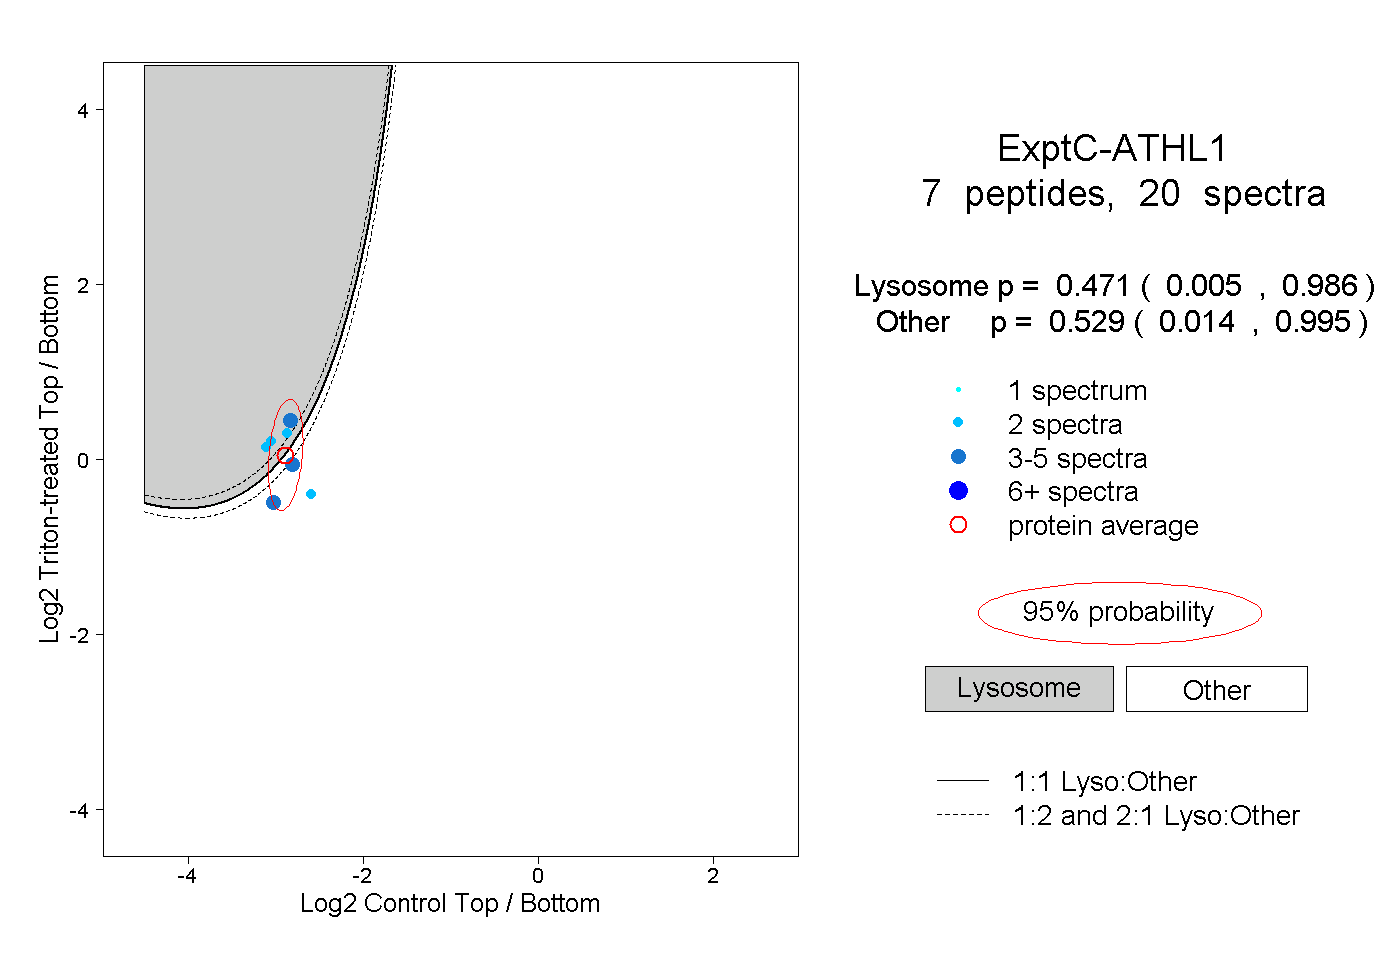 |
0.471 0.005 | 0.986 |
0.529 0.014 | 0.995 |