 6
6peptides
spectra
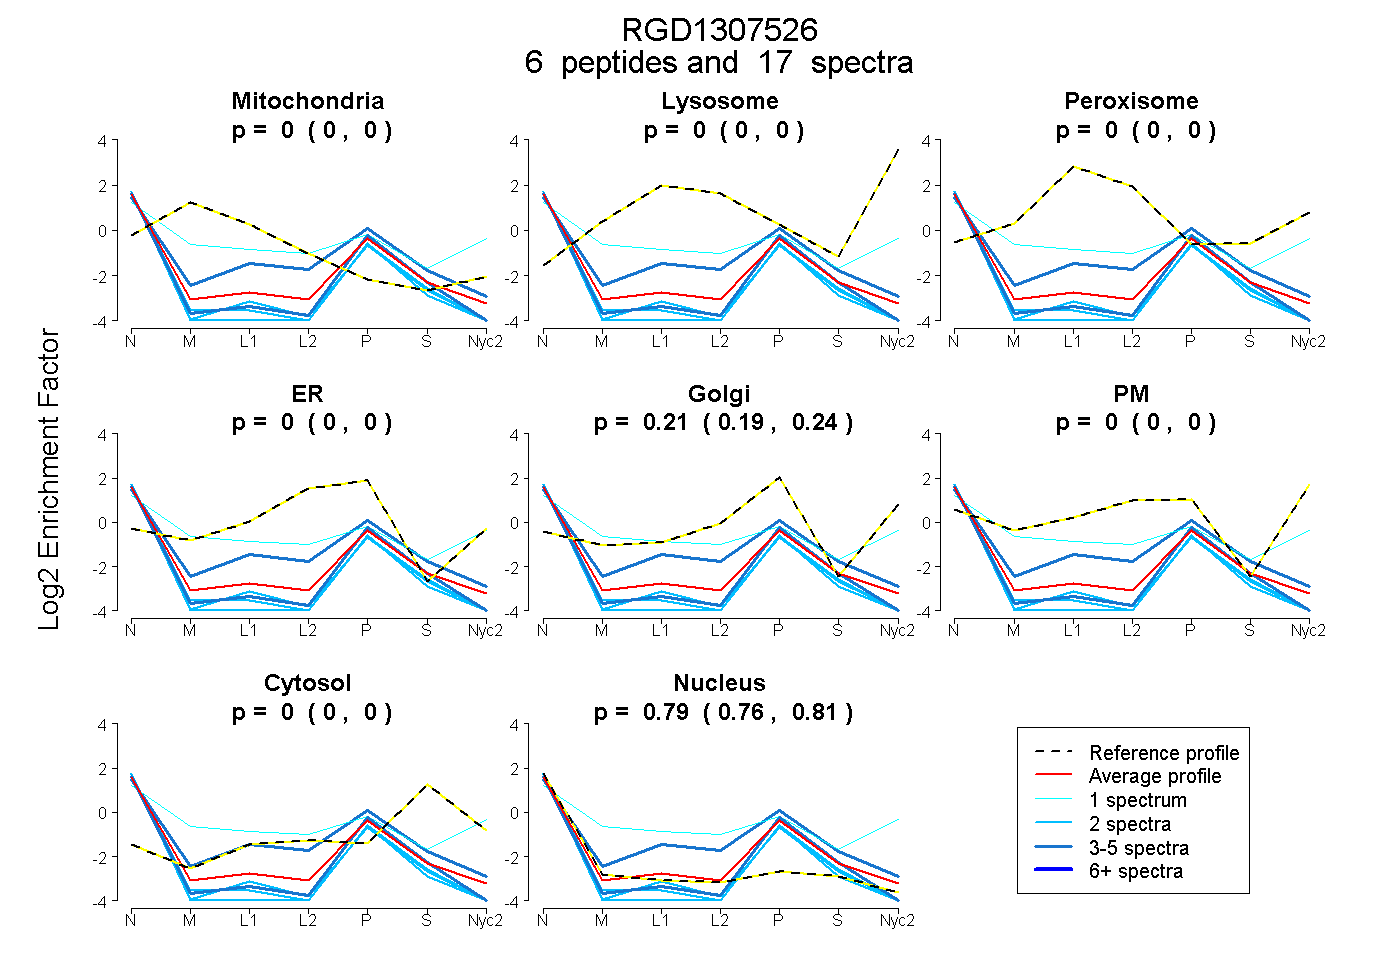
0.000 | 0.000
0.000 | 0.000
0.000 | 0.000
0.000 | 0.000
0.188 | 0.236
0.000 | 0.000
0.000 | 0.003
0.759 | 0.808
1peptide
spectrum

NA | NA
NA | NA
NA | NA
NA | NA
NA | NA
NA | NA
NA | NA
| Plot | Mito | Lyso | Perox | ER | Golgi | PM | Cytosol | Nucleus | |||||
| Expt A |
6 peptides |
17 spectra |
|
0.000 0.000 | 0.000 |
0.000 0.000 | 0.000 |
0.000 0.000 | 0.000 |
0.000 0.000 | 0.000 |
0.215 0.188 | 0.236 |
0.000 0.000 | 0.000 |
0.000 0.000 | 0.003 |
0.785 0.759 | 0.808 |
||
| Plot | Mito | Lyso or Perox | ER | Golgi | PM | Cytosol | Nucleus | ||||||
| Expt B |
1 peptide |
1 spectrum |
|
0.038 NA | NA |
0.274 NA | NA |
0.000 NA | NA |
0.000 NA | NA |
0.057 NA | NA |
0.097 NA | NA |
0.533 NA | NA |