41
41peptides
spectra
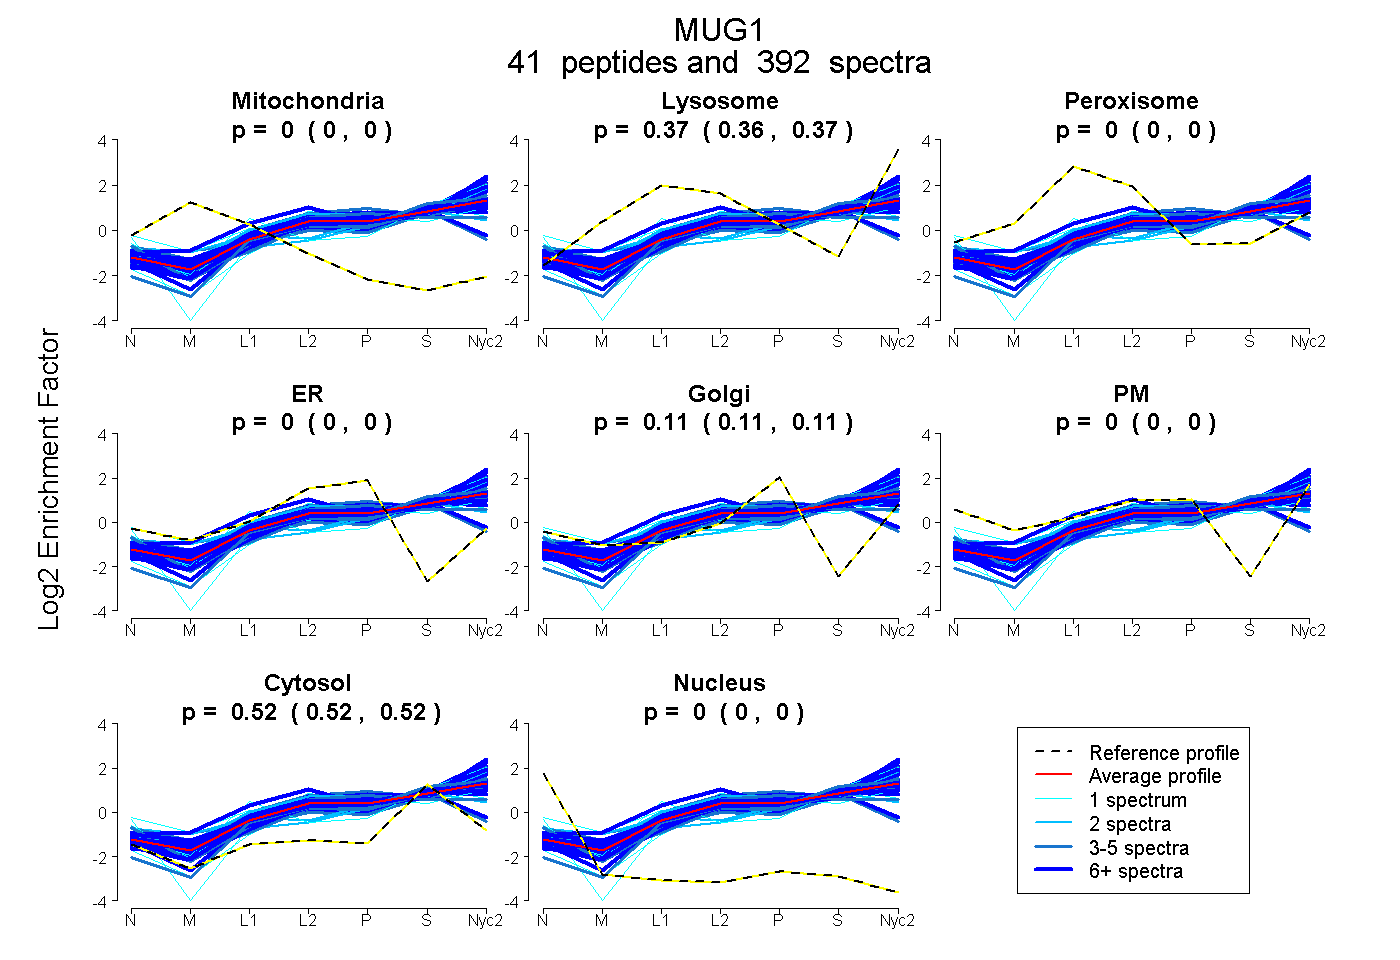
0.000 | 0.000
0.364 | 0.367
0.000 | 0.000
0.000 | 0.000
0.110 | 0.112
0.000 | 0.000
0.523 | 0.524
0.000 | 0.000
10peptides
spectra
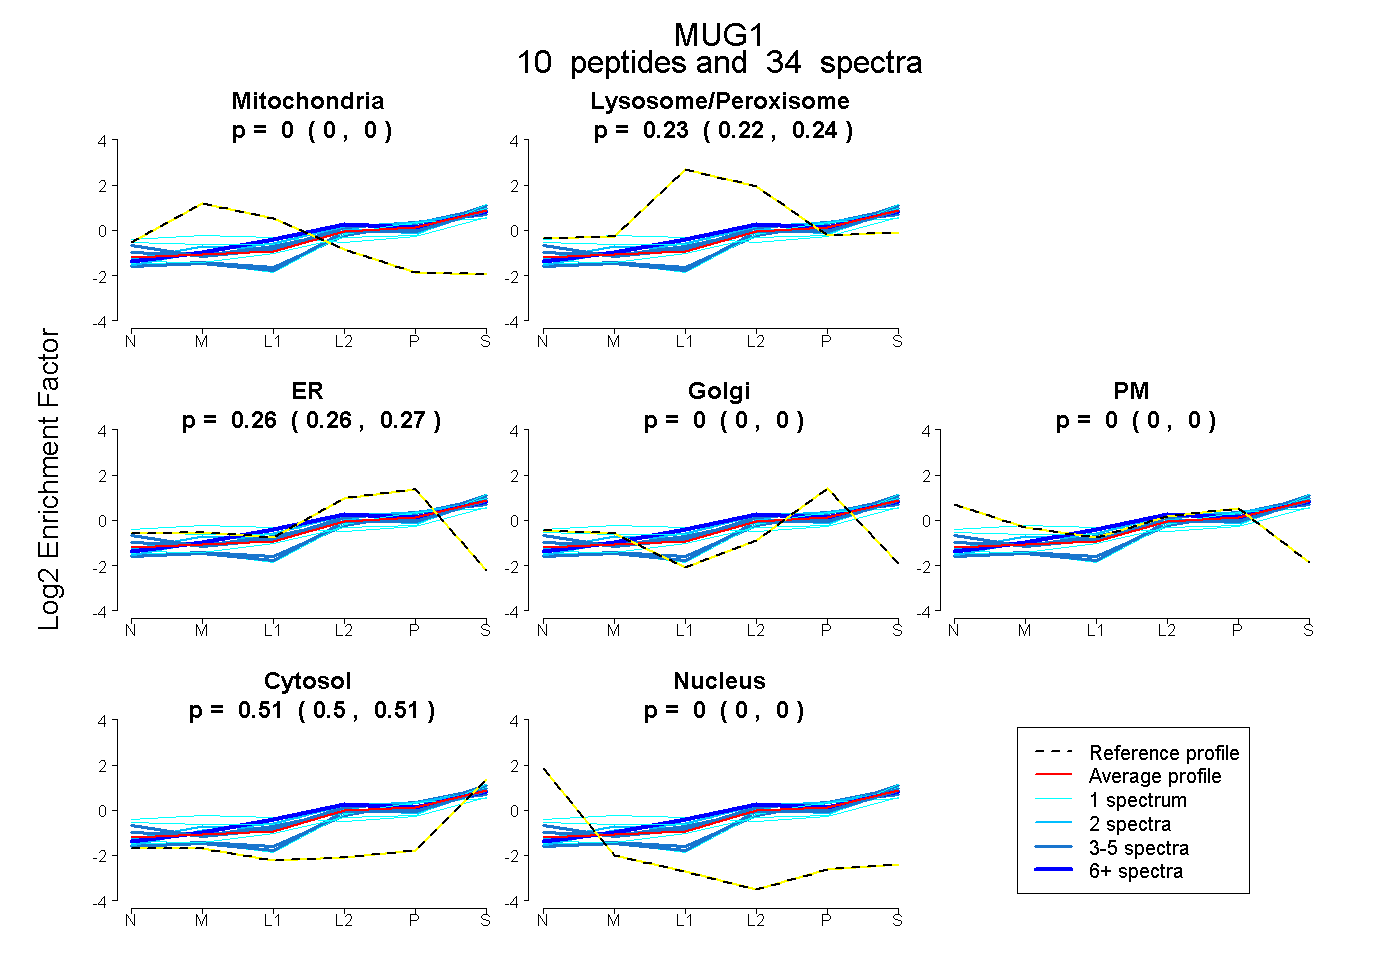
0.000 | 0.000
0.217 | 0.237
0.255 | 0.272
0.000 | 0.000
0.000 | 0.000
0.502 | 0.511
0.000 | 0.000
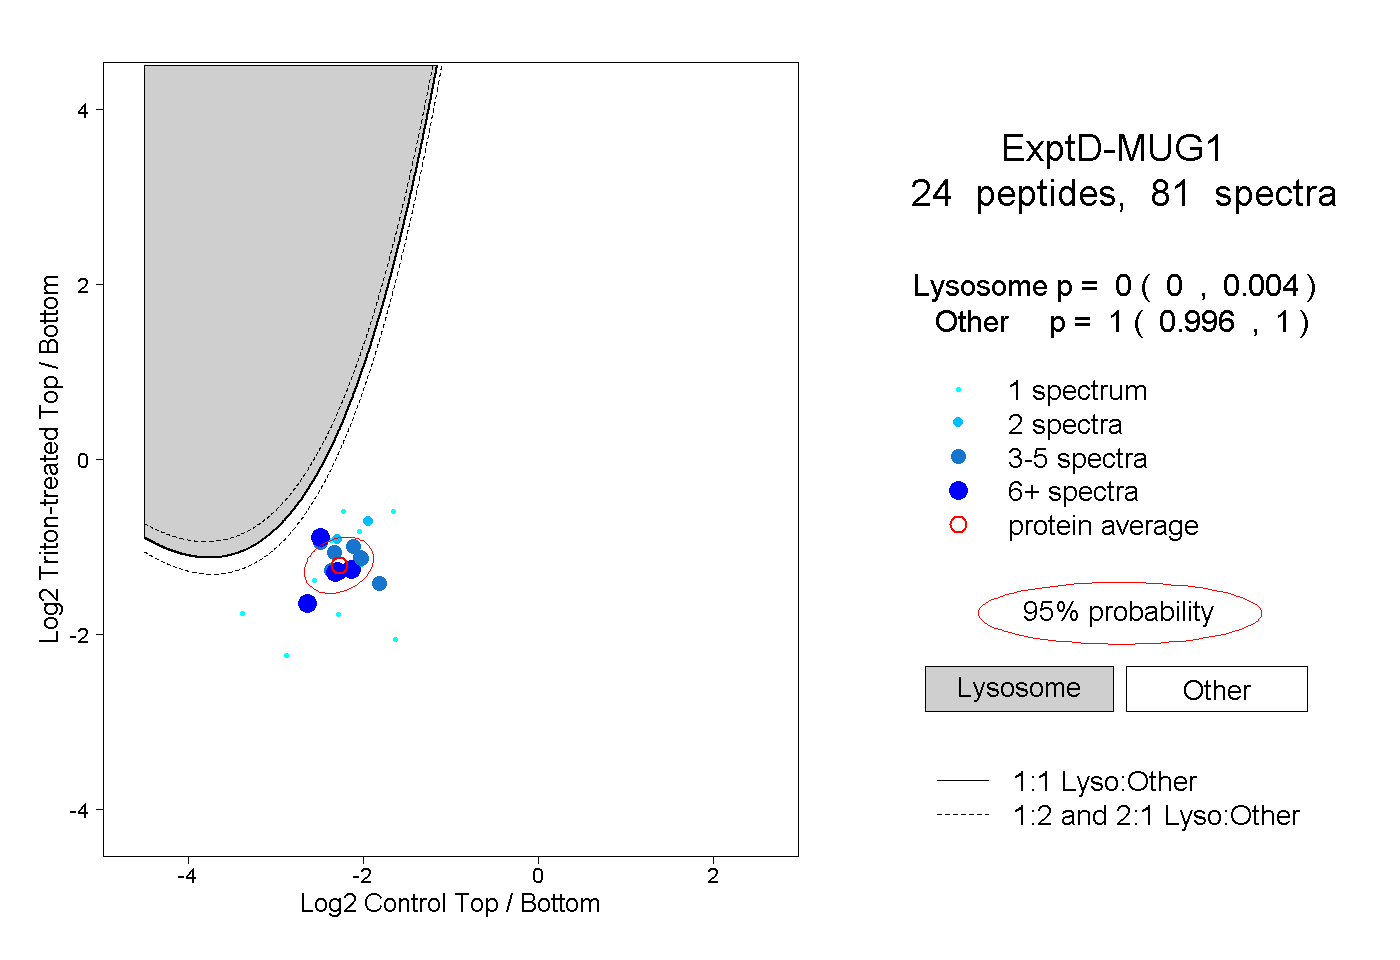
16peptides
spectra
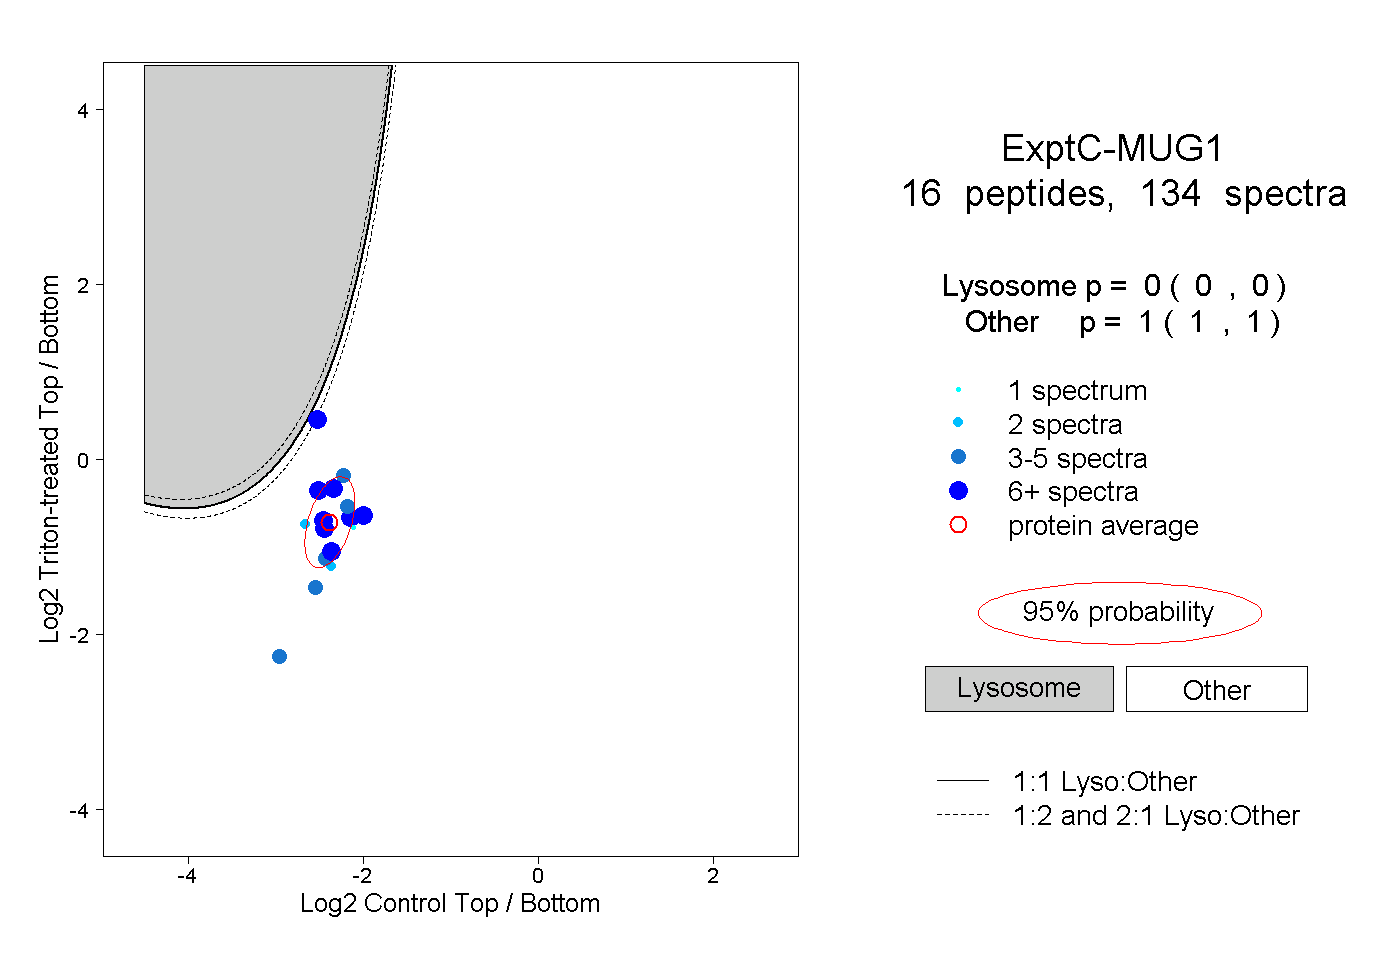
0.000 | 0.000
1.000 | 1.000