 28
28peptides
spectra
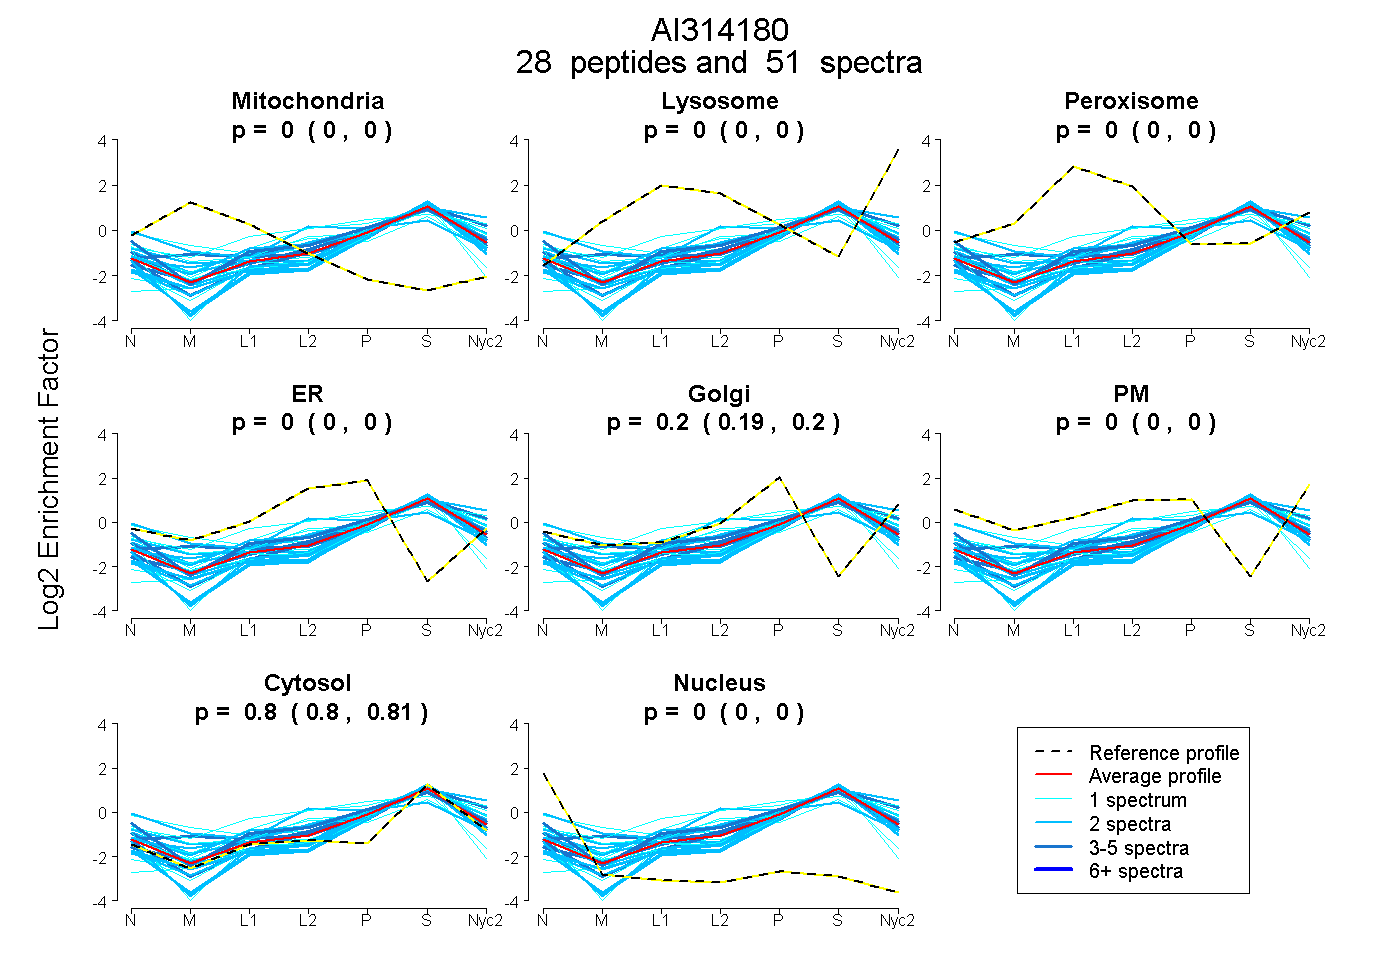
0.000 | 0.000
0.000 | 0.000
0.000 | 0.000
0.000 | 0.000
0.194 | 0.200
0.000 | 0.000
0.800 | 0.806
0.000 | 0.000
3peptides
spectra
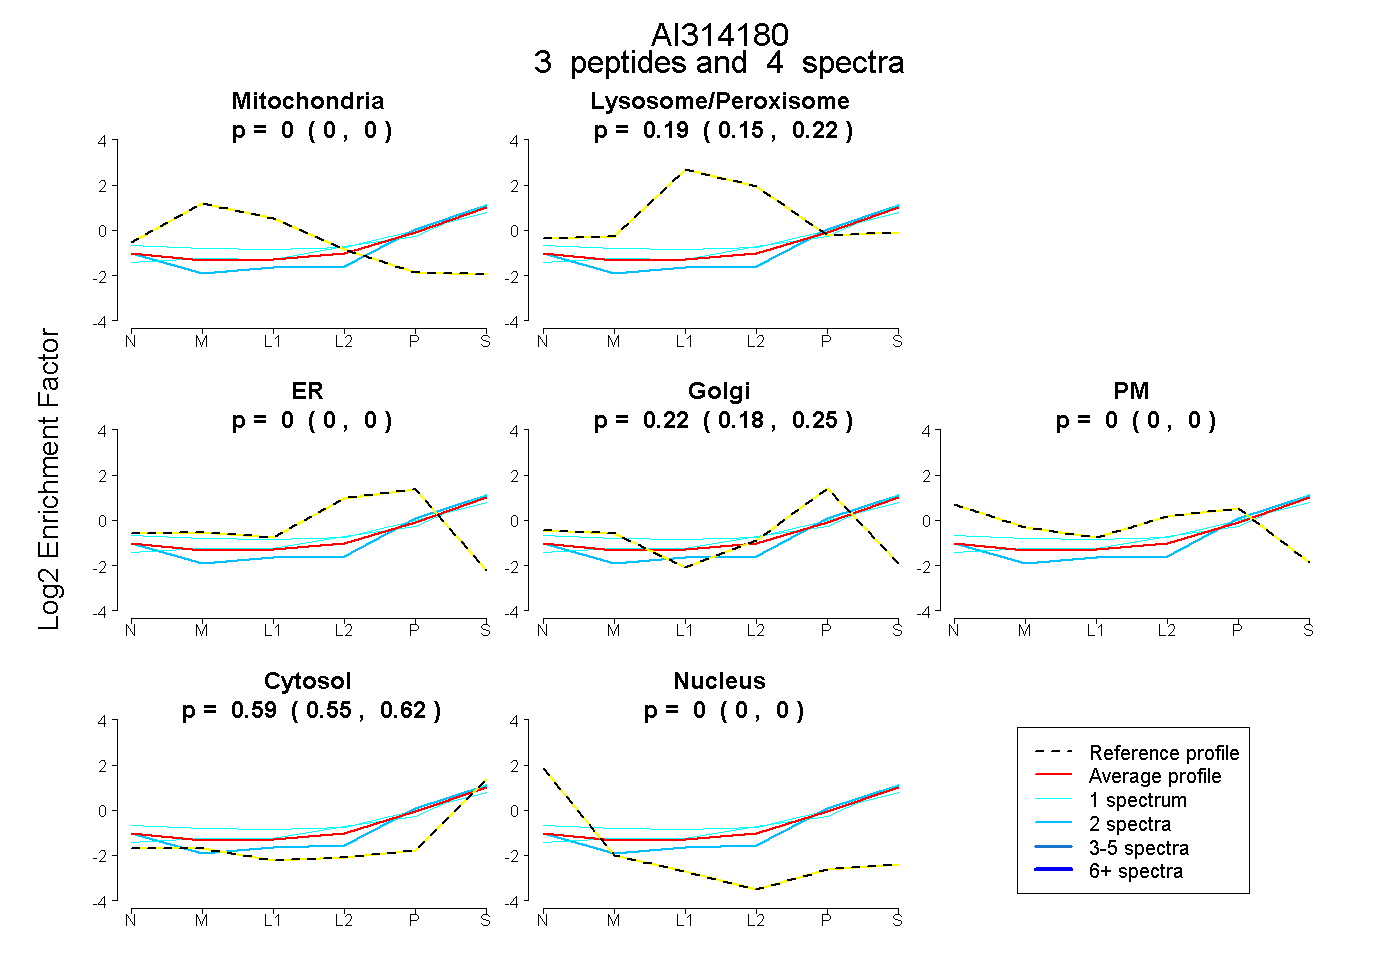
0.000 | 0.000
0.151 | 0.224
0.000 | 0.000
0.183 | 0.252
0.000 | 0.000
0.549 | 0.615
0.000 | 0.000
9peptides
spectra
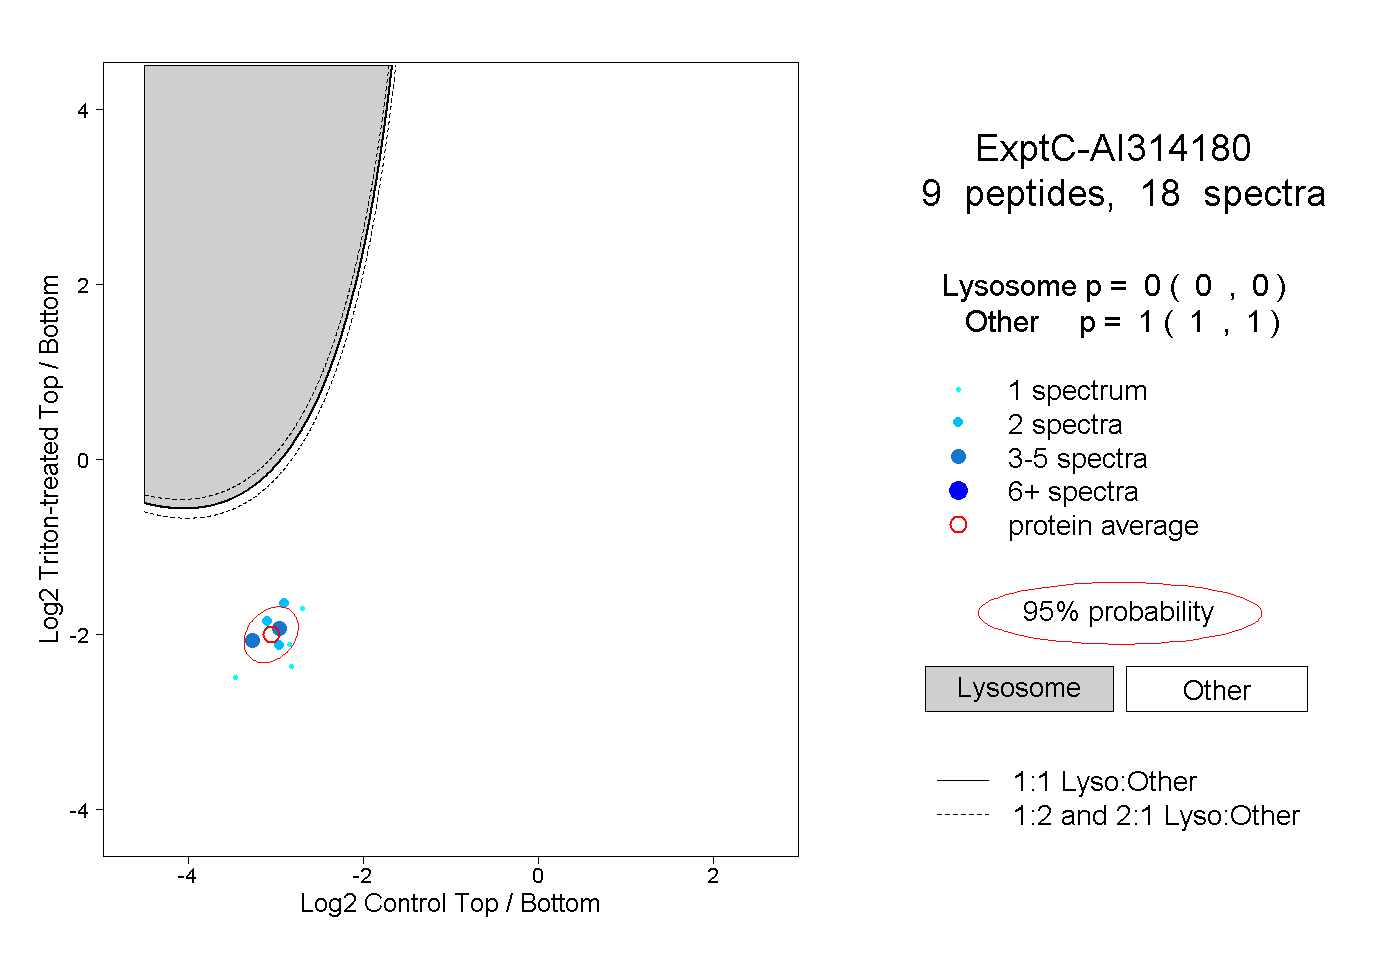
0.000 | 0.000
1.000 | 1.000
1peptide
spectrum
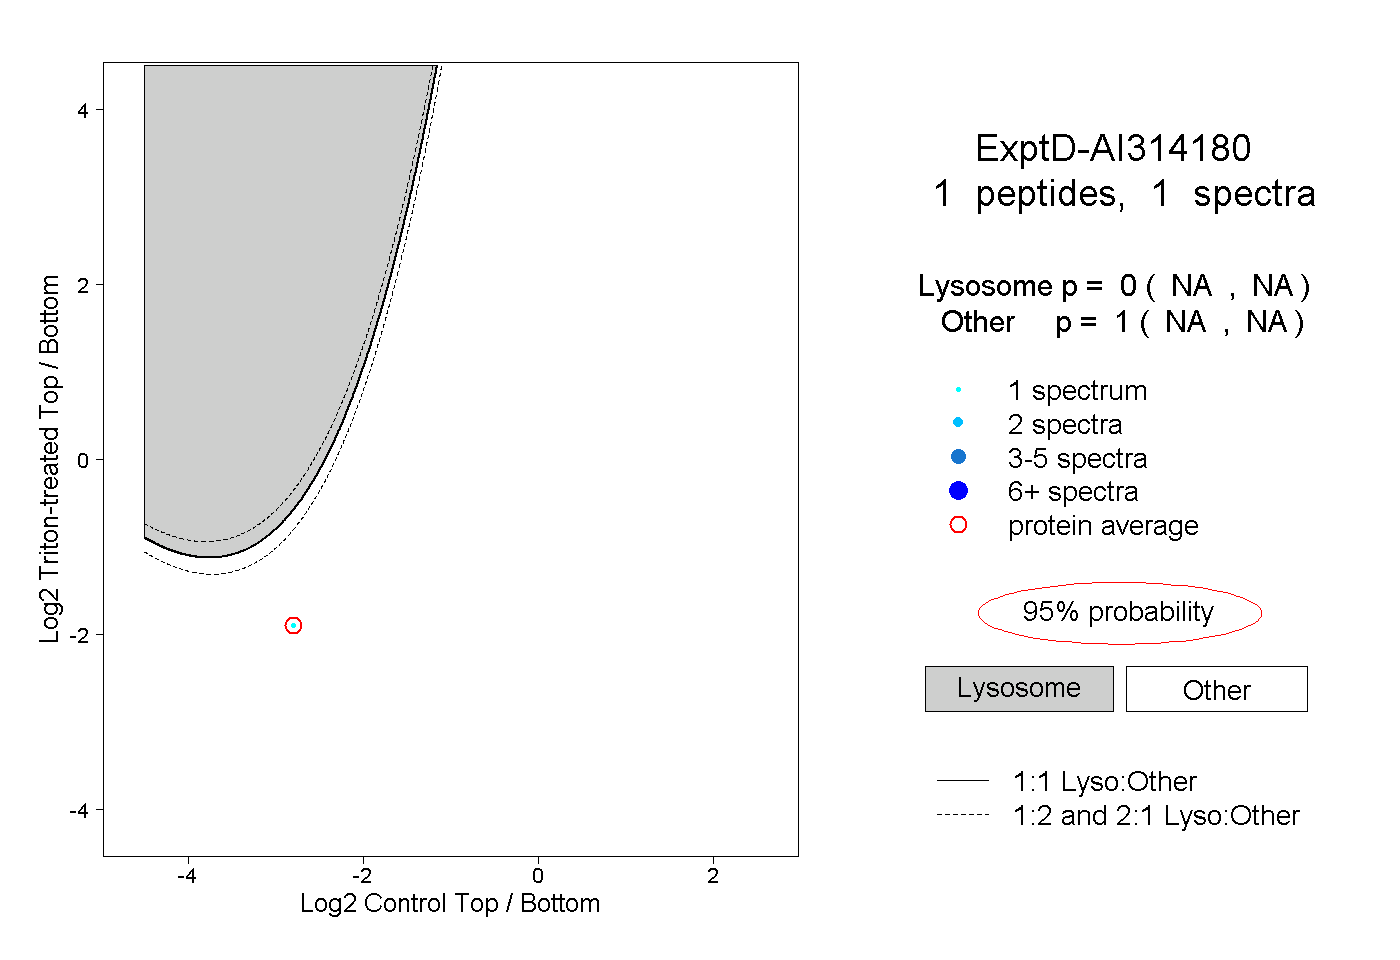
NA | NA
NA | NA