 23
23peptides
spectra
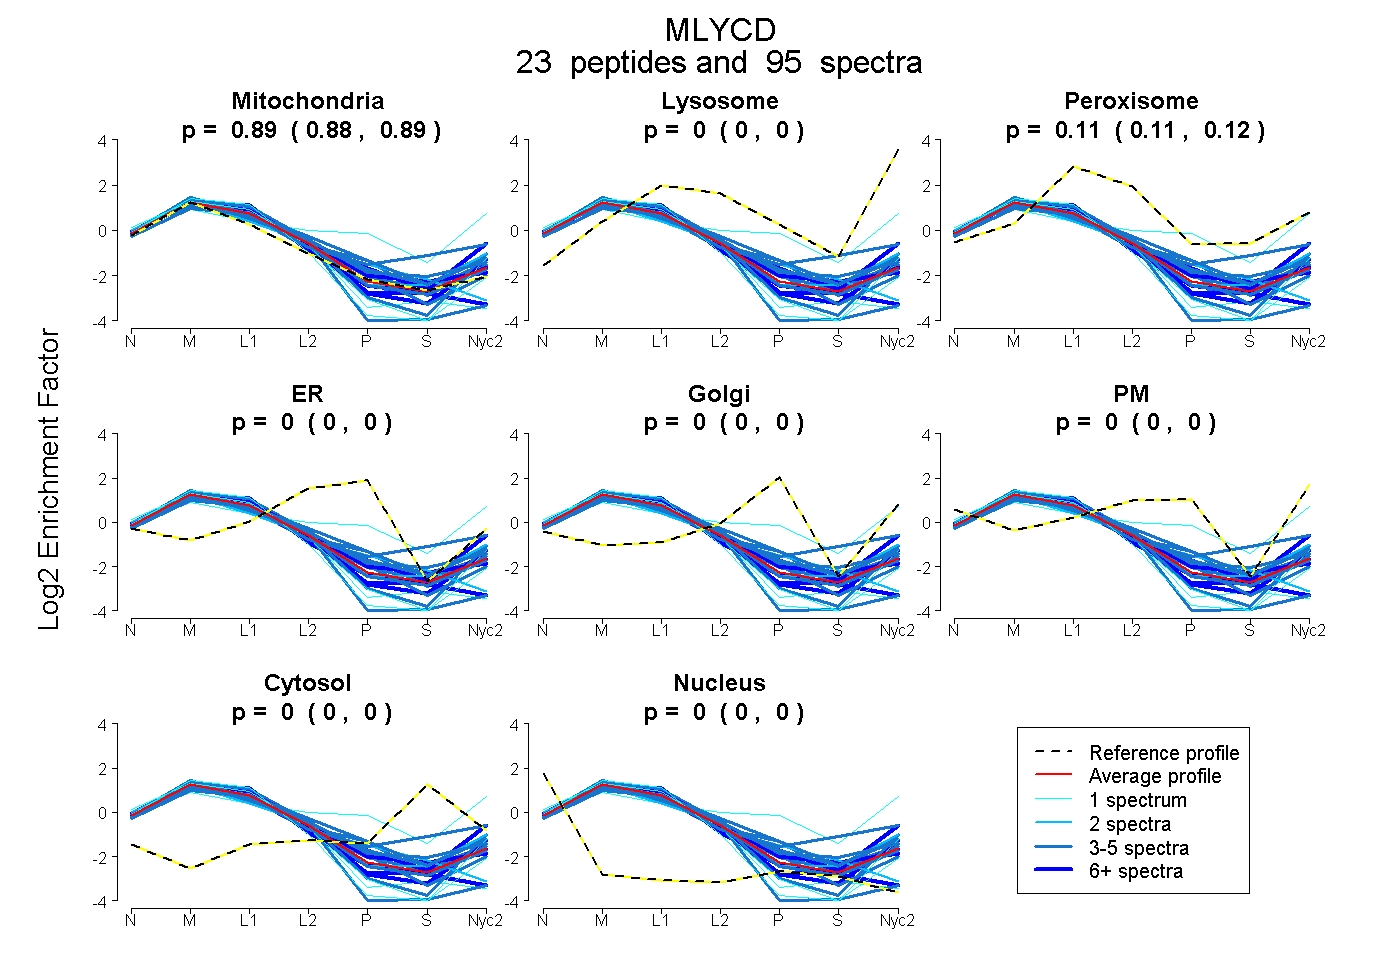
0.883 | 0.892
0.000 | 0.000
0.108 | 0.116
0.000 | 0.000
0.000 | 0.000
0.000 | 0.000
0.000 | 0.000
0.000 | 0.000
17peptides
spectra
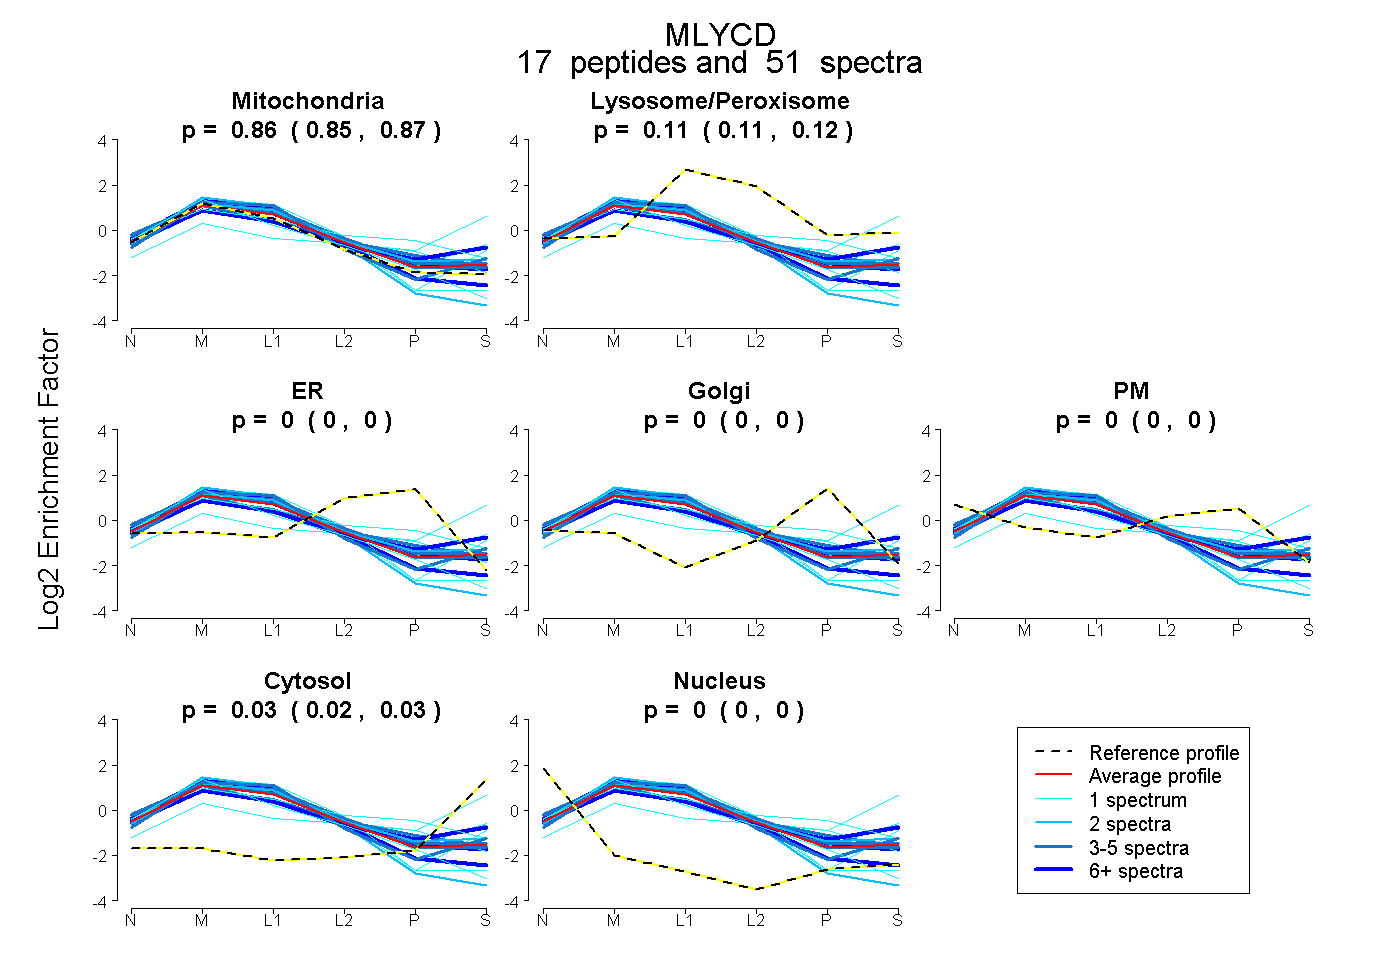
0.848 | 0.870
0.107 | 0.119
0.000 | 0.000
0.000 | 0.005
0.000 | 0.000
0.018 | 0.031
0.000 | 0.000
25peptides
spectra
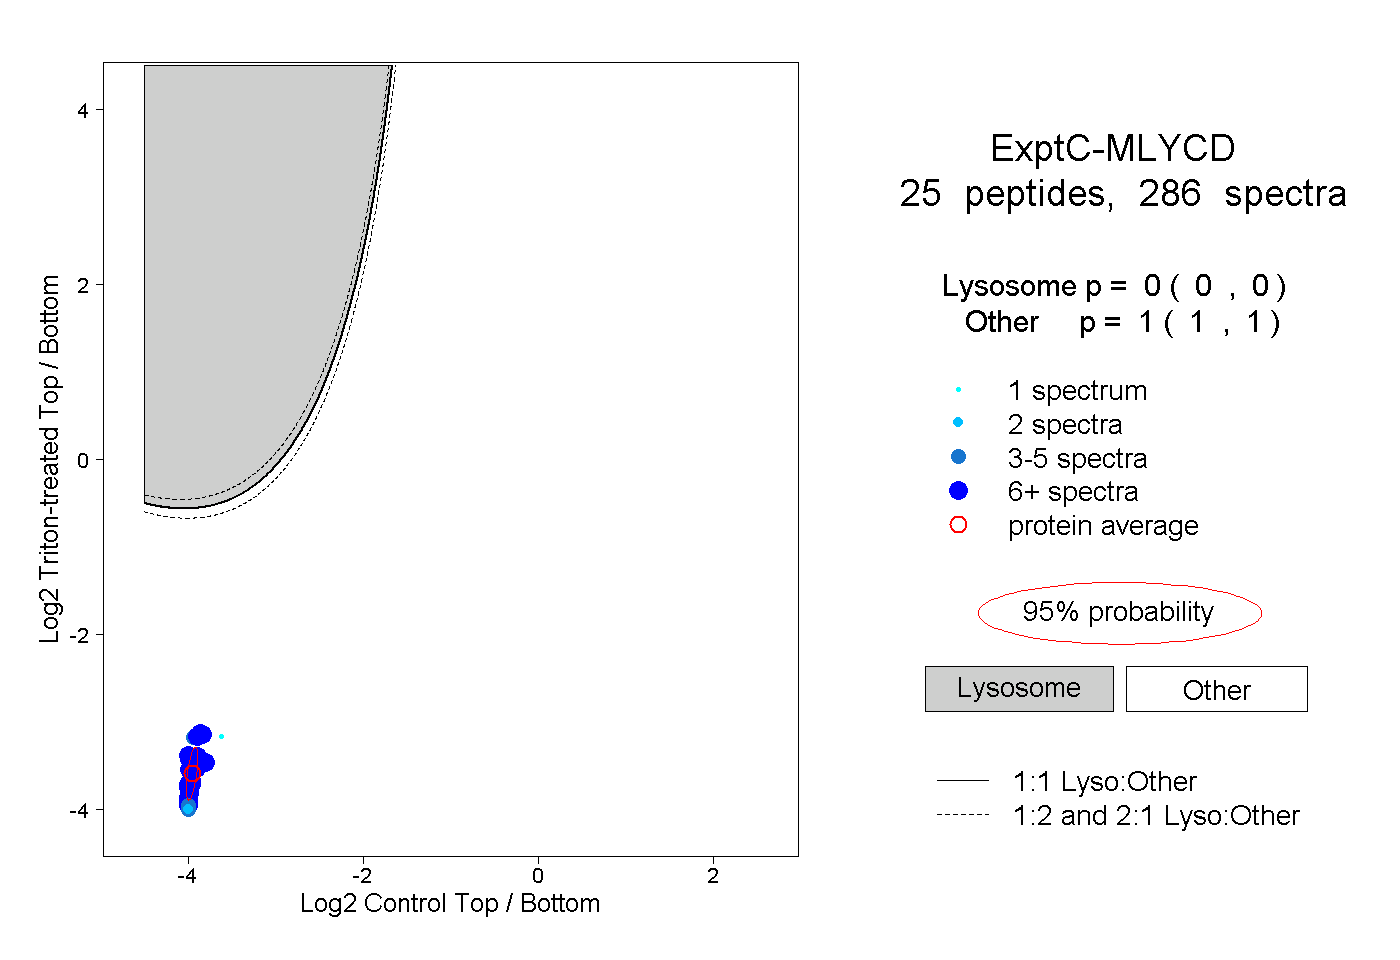
0.000 | 0.000
1.000 | 1.000
9peptides
spectra
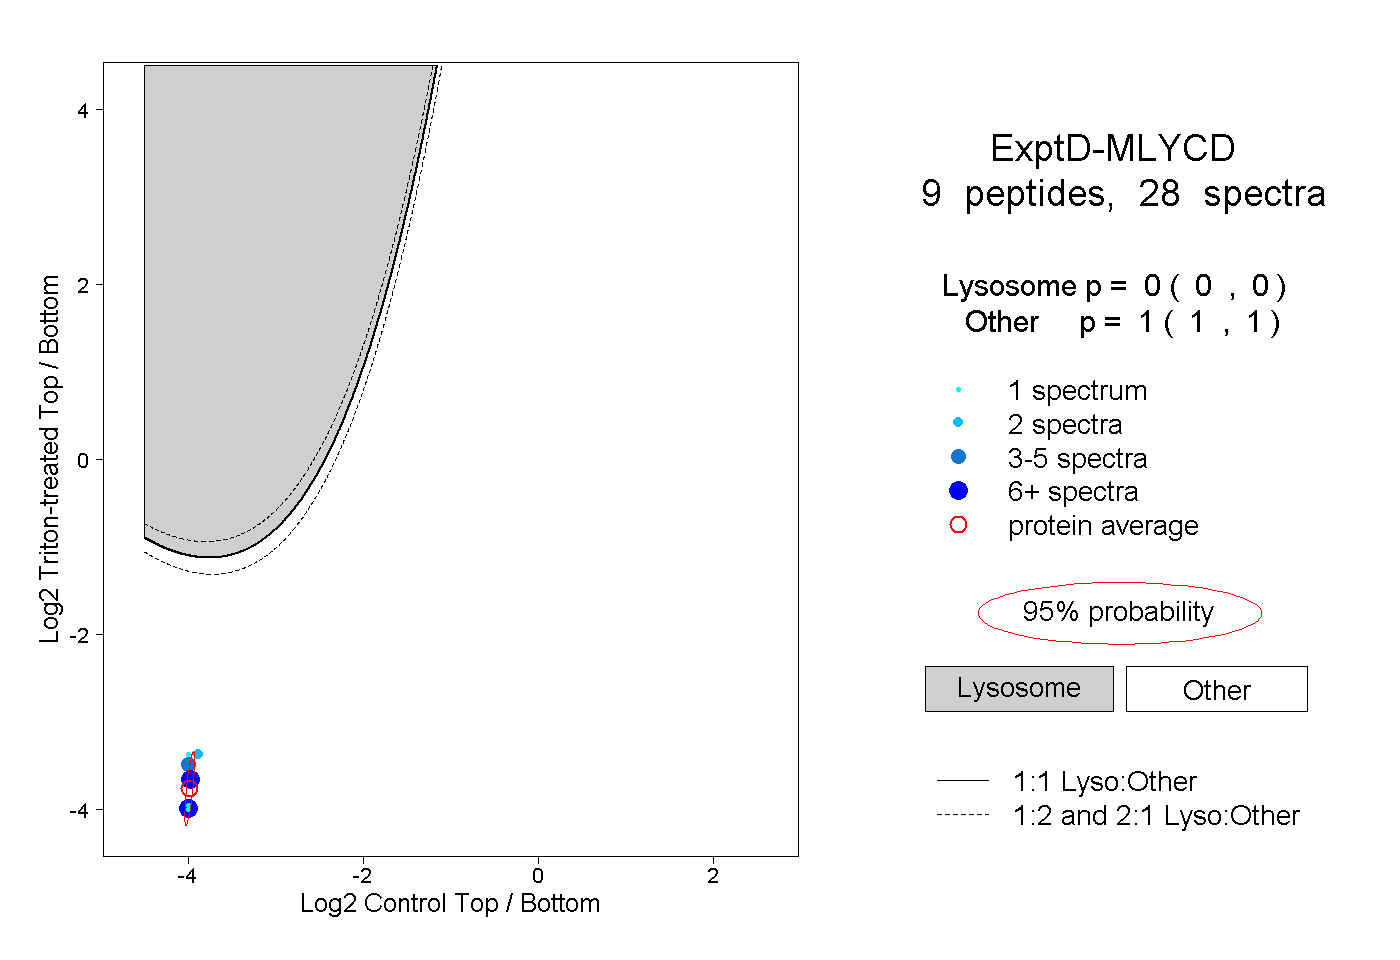
0.000 | 0.000
1.000 | 1.000