 23
23peptides
spectra
0.883 | 0.892
0.000 | 0.000
0.108 | 0.116
0.000 | 0.000
0.000 | 0.000
0.000 | 0.000
0.000 | 0.000
0.000 | 0.000
| Plot | Mito | Lyso | Perox | ER | Golgi | PM | Cytosol | Nucleus | |||||
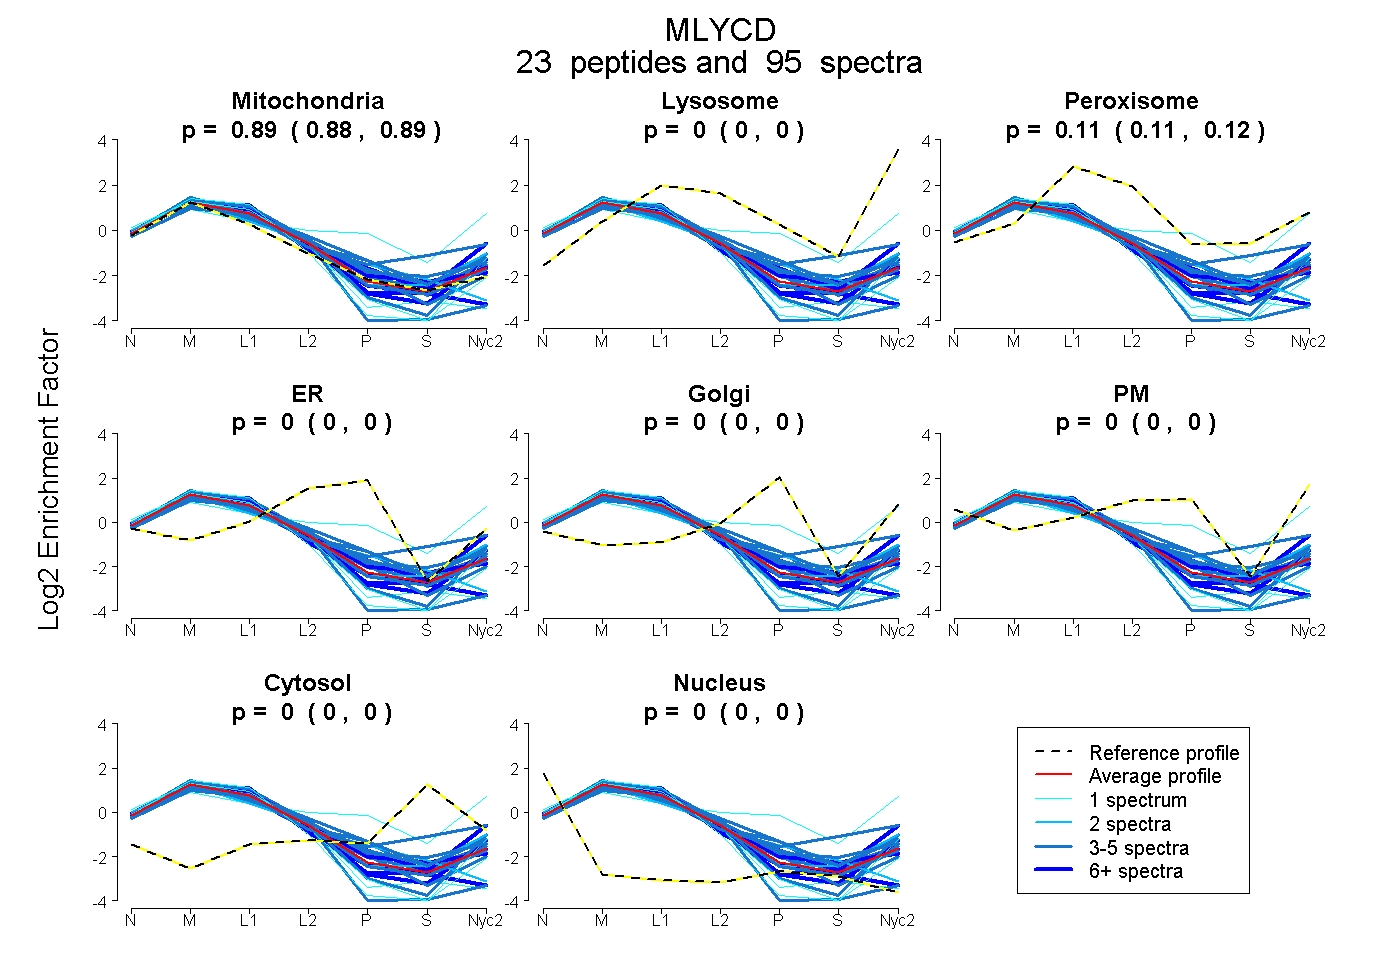
| Expt A |
23 peptides |
95 spectra |
|
0.888 0.883 | 0.892 |
0.000 0.000 | 0.000 |
0.112 0.108 | 0.116 |
0.000 0.000 | 0.000 |
0.000 0.000 | 0.000 |
0.000 0.000 | 0.000 |
0.000 0.000 | 0.000 |
0.000 0.000 | 0.000 |
| 5 spectra, AELLGR | 0.922 | 0.000 | 0.078 | 0.000 | 0.000 | 0.000 | 0.000 | 0.000 | ||
| 5 spectra, GYALNPVANFHLQNGAVMWR | 0.899 | 0.000 | 0.079 | 0.022 | 0.000 | 0.000 | 0.000 | 0.000 | ||
| 4 spectra, LAQALQGPLMR | 0.926 | 0.074 | 0.000 | 0.000 | 0.000 | 0.000 | 0.000 | 0.000 | ||
| 8 spectra, FLVQLR | 0.931 | 0.069 | 0.000 | 0.000 | 0.000 | 0.000 | 0.000 | 0.000 | ||
| 1 spectrum, ASEQILSLVAQFQSNSK | 0.882 | 0.000 | 0.118 | 0.000 | 0.000 | 0.000 | 0.000 | 0.000 | ||
| 1 spectrum, SMLSEWFSSGFLNLER | 0.968 | 0.032 | 0.000 | 0.000 | 0.000 | 0.000 | 0.000 | 0.000 | ||
| 5 spectra, NWMDMK | 0.728 | 0.028 | 0.137 | 0.066 | 0.000 | 0.041 | 0.000 | 0.000 | ||
| 5 spectra, YALVPR | 0.598 | 0.119 | 0.145 | 0.000 | 0.000 | 0.000 | 0.138 | 0.000 | ||
| 9 spectra, GLTSSCGLMVNYR | 1.000 | 0.000 | 0.000 | 0.000 | 0.000 | 0.000 | 0.000 | 0.000 | ||
| 2 spectra, LVEGPHVR | 0.858 | 0.125 | 0.010 | 0.000 | 0.000 | 0.000 | 0.000 | 0.007 | ||
| 1 spectrum, INWMADSSLK | 0.361 | 0.269 | 0.000 | 0.000 | 0.043 | 0.267 | 0.060 | 0.000 | ||
| 5 spectra, LDGGVR | 0.802 | 0.114 | 0.028 | 0.000 | 0.000 | 0.055 | 0.000 | 0.000 | ||
| 6 spectra, EAAVLLQAEDR | 0.942 | 0.000 | 0.058 | 0.000 | 0.000 | 0.000 | 0.000 | 0.000 | ||
| 1 spectrum, ECPPSETEEK | 1.000 | 0.000 | 0.000 | 0.000 | 0.000 | 0.000 | 0.000 | 0.000 | ||
| 3 spectra, ADLLEAQALK | 0.809 | 0.000 | 0.012 | 0.078 | 0.000 | 0.101 | 0.000 | 0.000 | ||
| 1 spectrum, YYLEETGPNSISYLGSK | 1.000 | 0.000 | 0.000 | 0.000 | 0.000 | 0.000 | 0.000 | 0.000 | ||
| 5 spectra, VTWHSPCEVLQK | 0.774 | 0.000 | 0.199 | 0.000 | 0.000 | 0.009 | 0.012 | 0.006 | ||
| 8 spectra, GLLSSGEWAK | 0.767 | 0.185 | 0.000 | 0.000 | 0.000 | 0.047 | 0.000 | 0.000 | ||
| 4 spectra, AVPPTPAYELR | 0.844 | 0.000 | 0.156 | 0.000 | 0.000 | 0.000 | 0.000 | 0.000 | ||
| 4 spectra, LAQGFGVDHGQVAEQSAGVLQLR | 0.993 | 0.000 | 0.000 | 0.000 | 0.000 | 0.000 | 0.000 | 0.007 | ||
| 2 spectra, LCAWYLYGEK | 0.947 | 0.000 | 0.008 | 0.046 | 0.000 | 0.000 | 0.000 | 0.000 | ||
| 6 spectra, ISECEAVHPVK | 0.850 | 0.000 | 0.150 | 0.000 | 0.000 | 0.000 | 0.000 | 0.000 | ||
| 4 spectra, NELFTDSECK | 0.918 | 0.000 | 0.082 | 0.000 | 0.000 | 0.000 | 0.000 | 0.000 |
| Plot | Mito | Lyso or Perox | ER | Golgi | PM | Cytosol | Nucleus | ||||||
| Expt B |
17 peptides |
51 spectra |
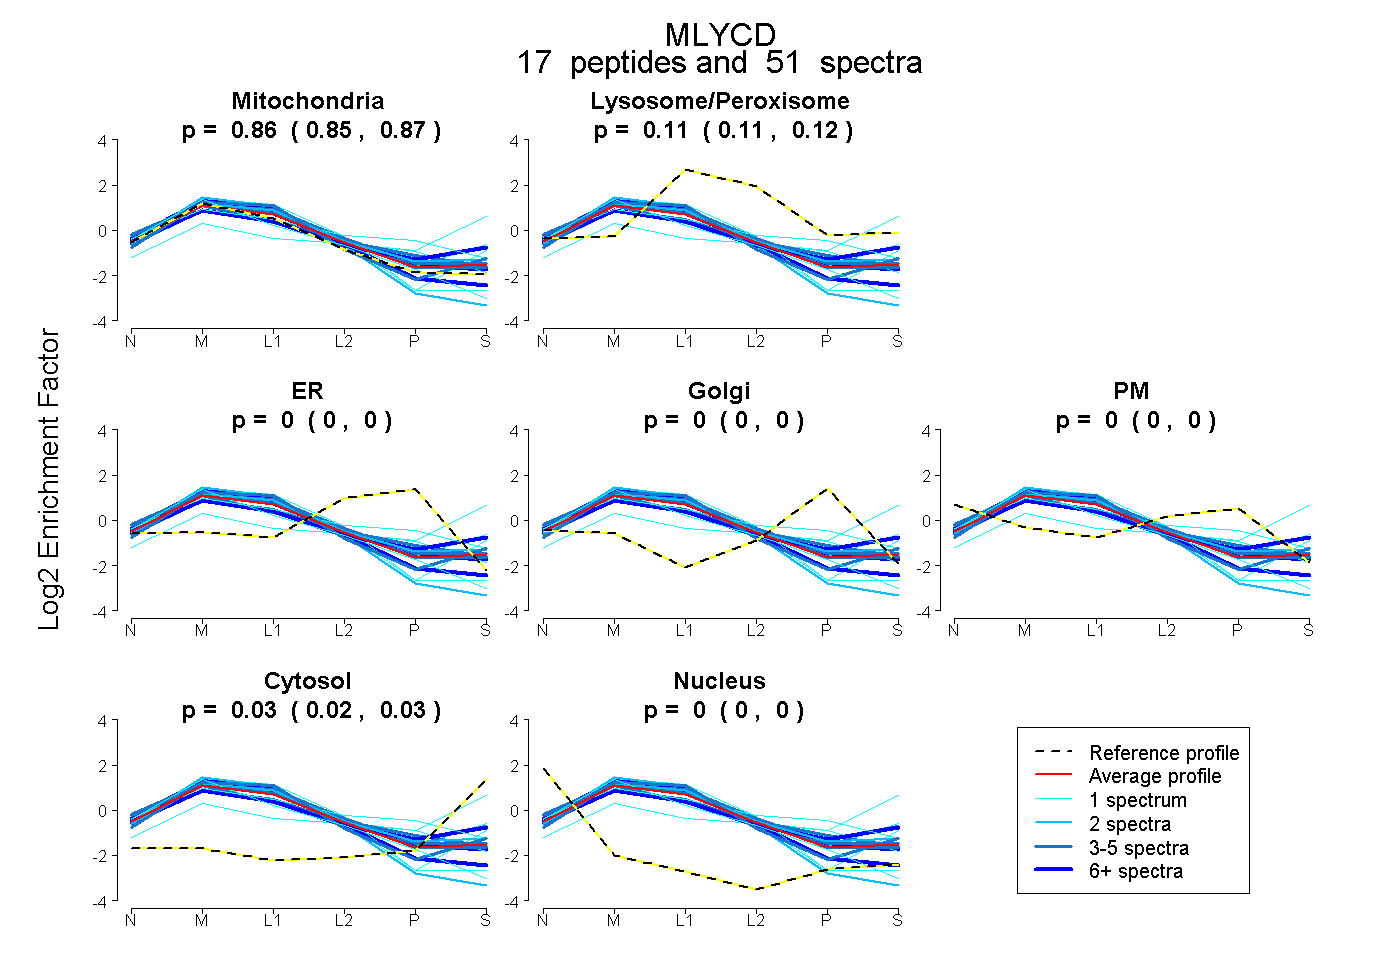 |
0.861 0.848 | 0.870 |
0.114 0.107 | 0.119 |
0.000 0.000 | 0.000 |
0.000 0.000 | 0.005 |
0.000 0.000 | 0.000 |
0.026 0.018 | 0.031 |
0.000 0.000 | 0.000 |
|||
| Plot | Lyso | Other | |||||||||||
| Expt C |
25 peptides |
286 spectra |
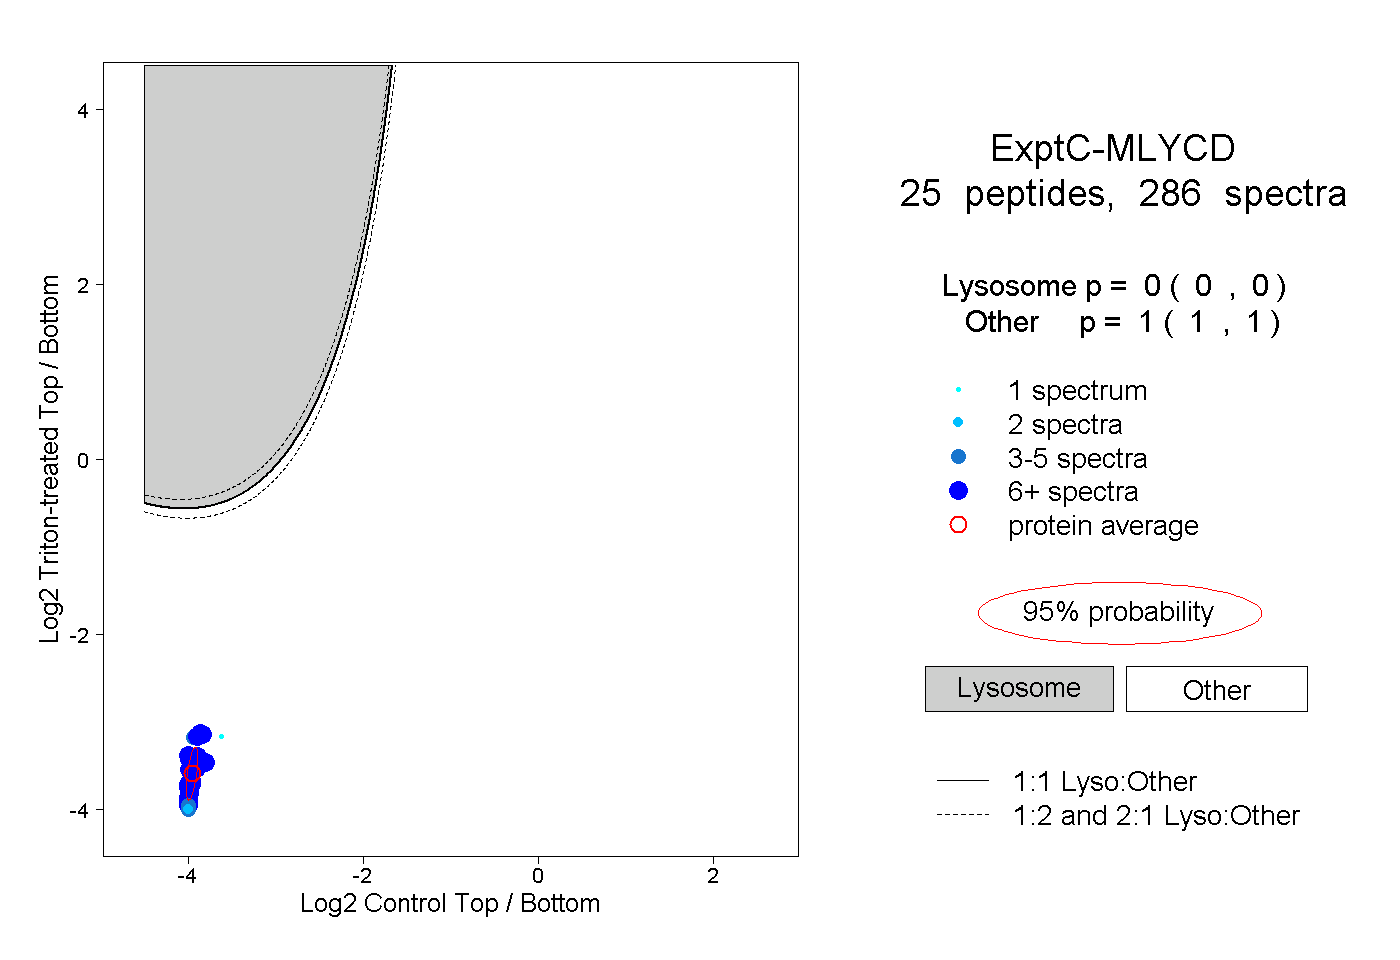 |
0.000 0.000 | 0.000 |
1.000 1.000 | 1.000 |
||||||||
| Plot | Lyso | Other | |||||||||||
| Expt D |
9 peptides |
28 spectra |
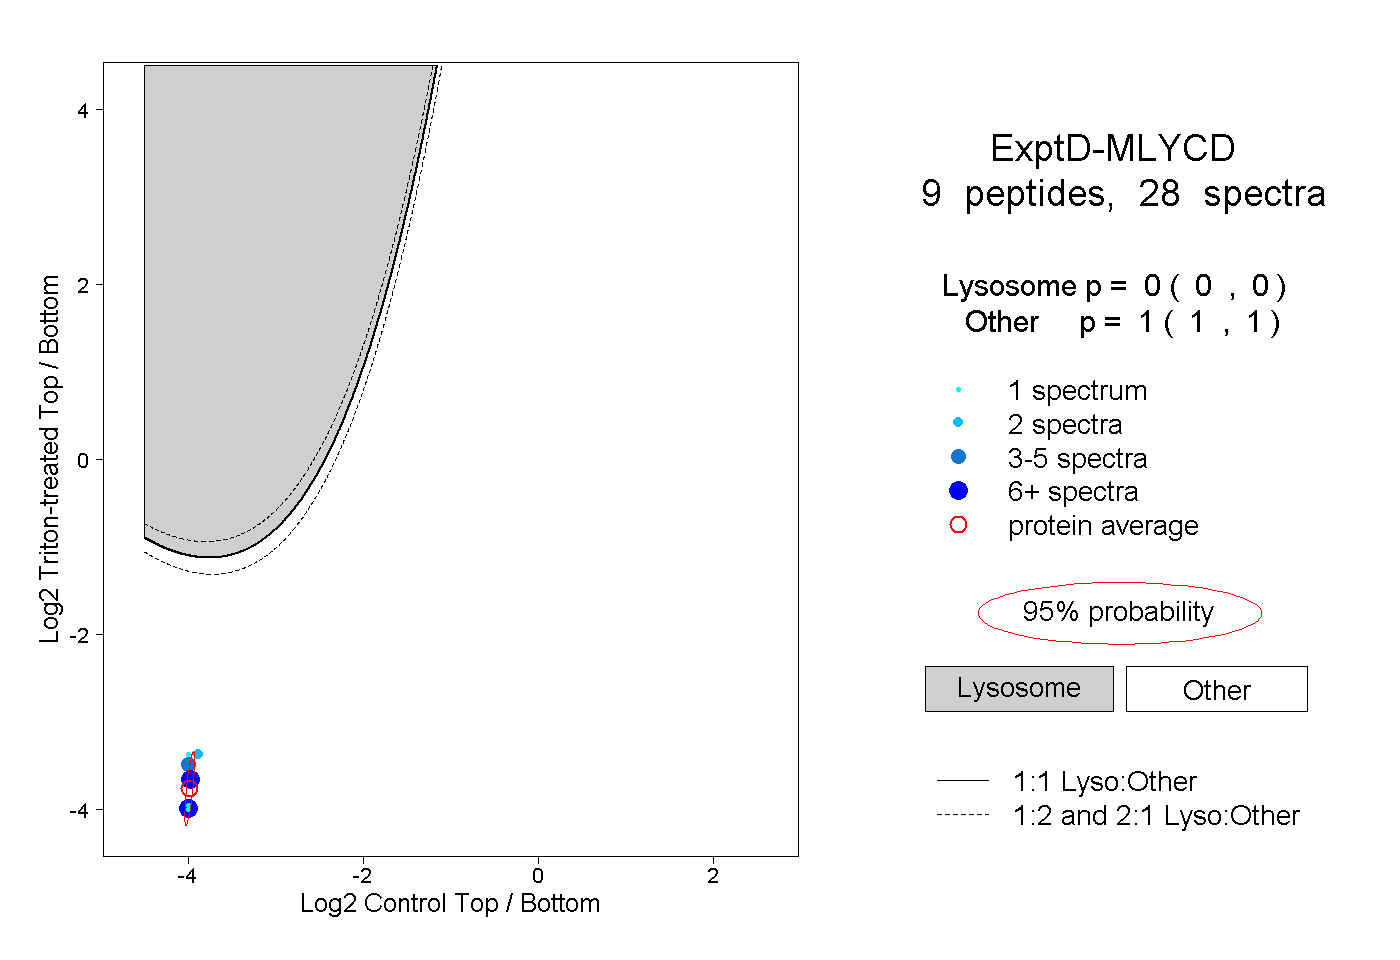 |
0.000 0.000 | 0.000 |
1.000 1.000 | 1.000 |