 7
7peptides
spectra
0.000 | 0.000
0.000 | 0.000
0.000 | 0.000
0.033 | 0.075
0.000 | 0.000
0.000 | 0.000
0.907 | 0.946
0.000 | 0.037
| Plot | Mito | Lyso | Perox | ER | Golgi | PM | Cytosol | Nucleus | |||||
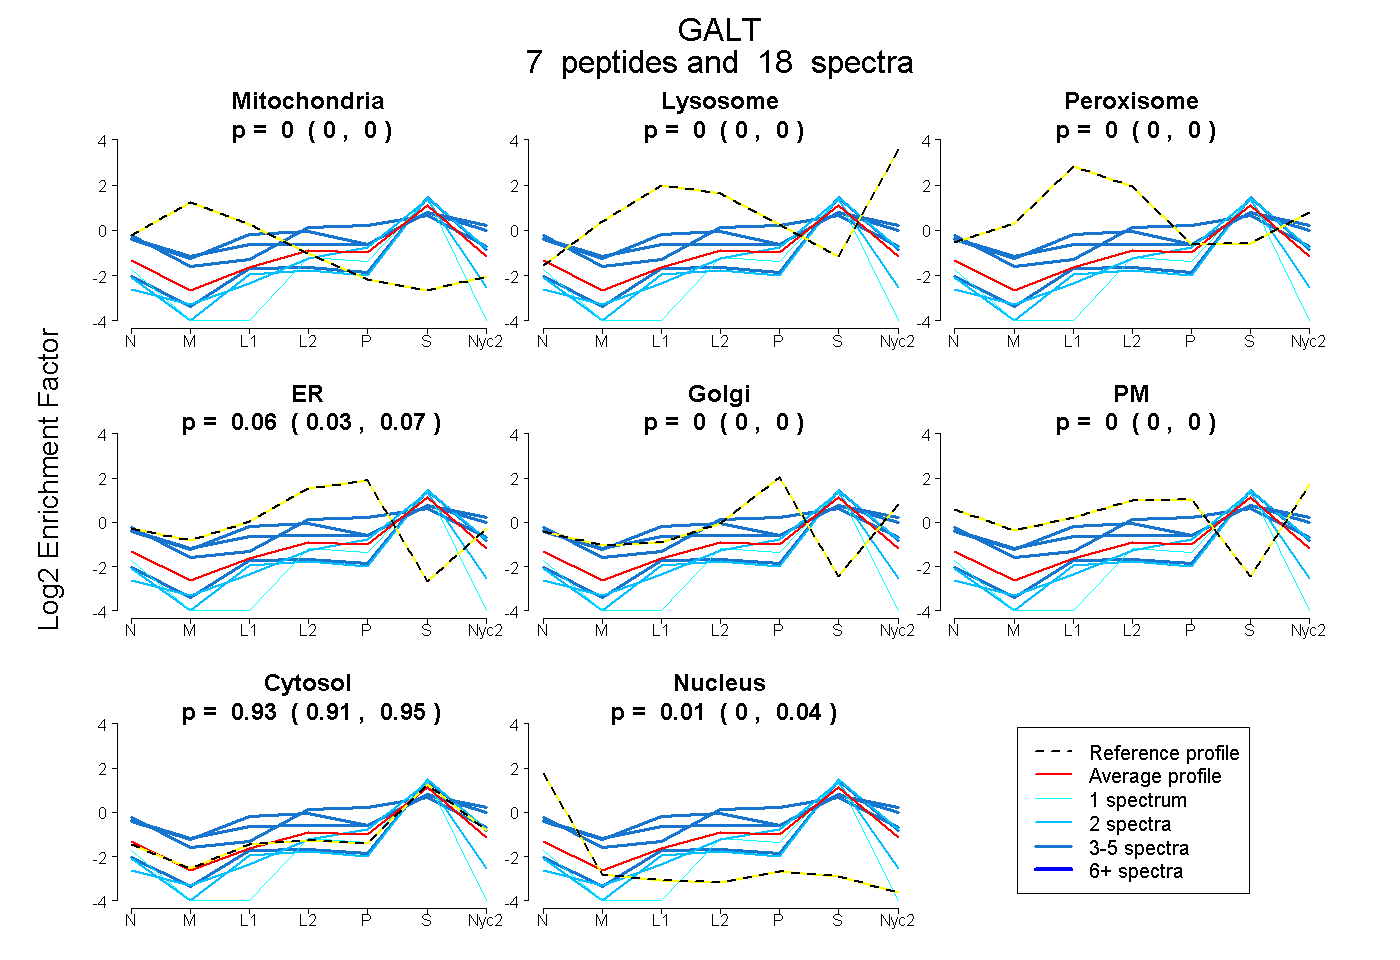
| Expt A |
7 peptides |
18 spectra |
|
0.000 0.000 | 0.000 |
0.000 0.000 | 0.000 |
0.000 0.000 | 0.000 |
0.056 0.033 | 0.075 |
0.000 0.000 | 0.000 |
0.000 0.000 | 0.000 |
0.929 0.907 | 0.946 |
0.015 0.000 | 0.037 |
| 2 spectra, YNPLQDEWVLVSAHR | 0.000 | 0.000 | 0.000 | 0.000 | 0.000 | 0.000 | 0.968 | 0.032 | ||
| 3 spectra, QQASEADAMAATFR | 0.000 | 0.007 | 0.252 | 0.000 | 0.000 | 0.163 | 0.578 | 0.000 | ||
| 3 spectra, HDPLNPLCPGATR | 0.000 | 0.000 | 0.000 | 0.327 | 0.000 | 0.039 | 0.634 | 0.000 | ||
| 1 spectrum, VLPEVHYCLTQK | 0.000 | 0.000 | 0.000 | 0.000 | 0.000 | 0.000 | 0.731 | 0.269 | ||
| 3 spectra, ASEHQHIR | 0.003 | 0.000 | 0.135 | 0.000 | 0.000 | 0.209 | 0.654 | 0.000 | ||
| 2 spectra, LPELTPAER | 0.000 | 0.000 | 0.000 | 0.000 | 0.000 | 0.000 | 1.000 | 0.000 | ||
| 4 spectra, DLTPEQAAER | 0.000 | 0.000 | 0.000 | 0.000 | 0.000 | 0.000 | 1.000 | 0.000 |
| Plot | Mito | Lyso or Perox | ER | Golgi | PM | Cytosol | Nucleus | ||||||
| Expt B |
3 peptides |
5 spectra |
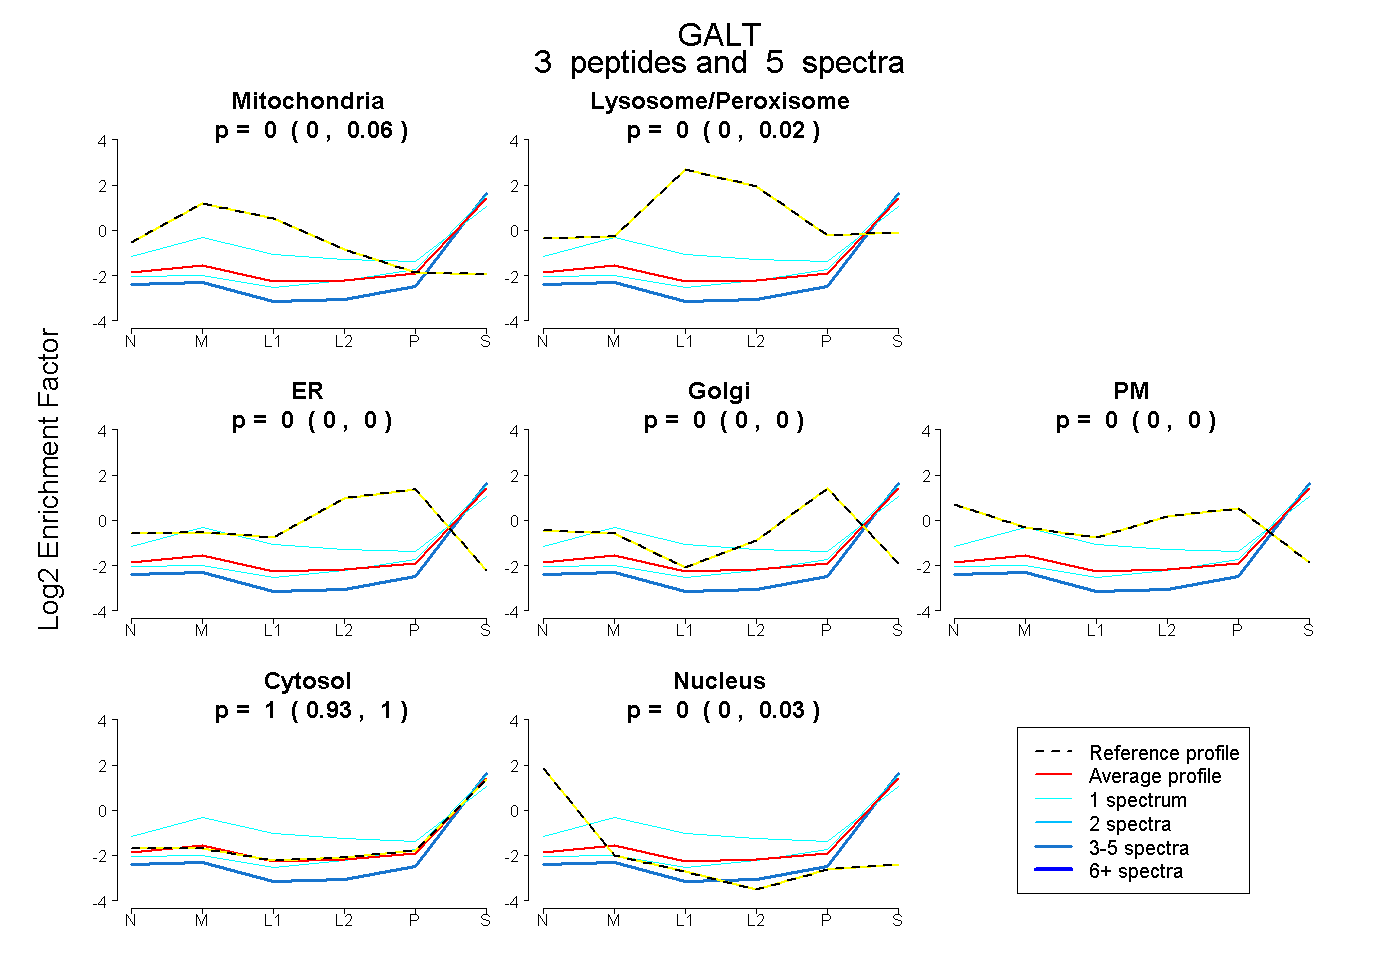 |
0.000 0.000 | 0.057 |
0.000 0.000 | 0.025 |
0.000 0.000 | 0.000 |
0.000 0.000 | 0.000 |
0.000 0.000 | 0.000 |
1.000 0.928 | 1.000 |
0.000 0.000 | 0.026 |
|||
| Plot | Lyso | Other | |||||||||||
| Expt C |
4 peptides |
15 spectra |
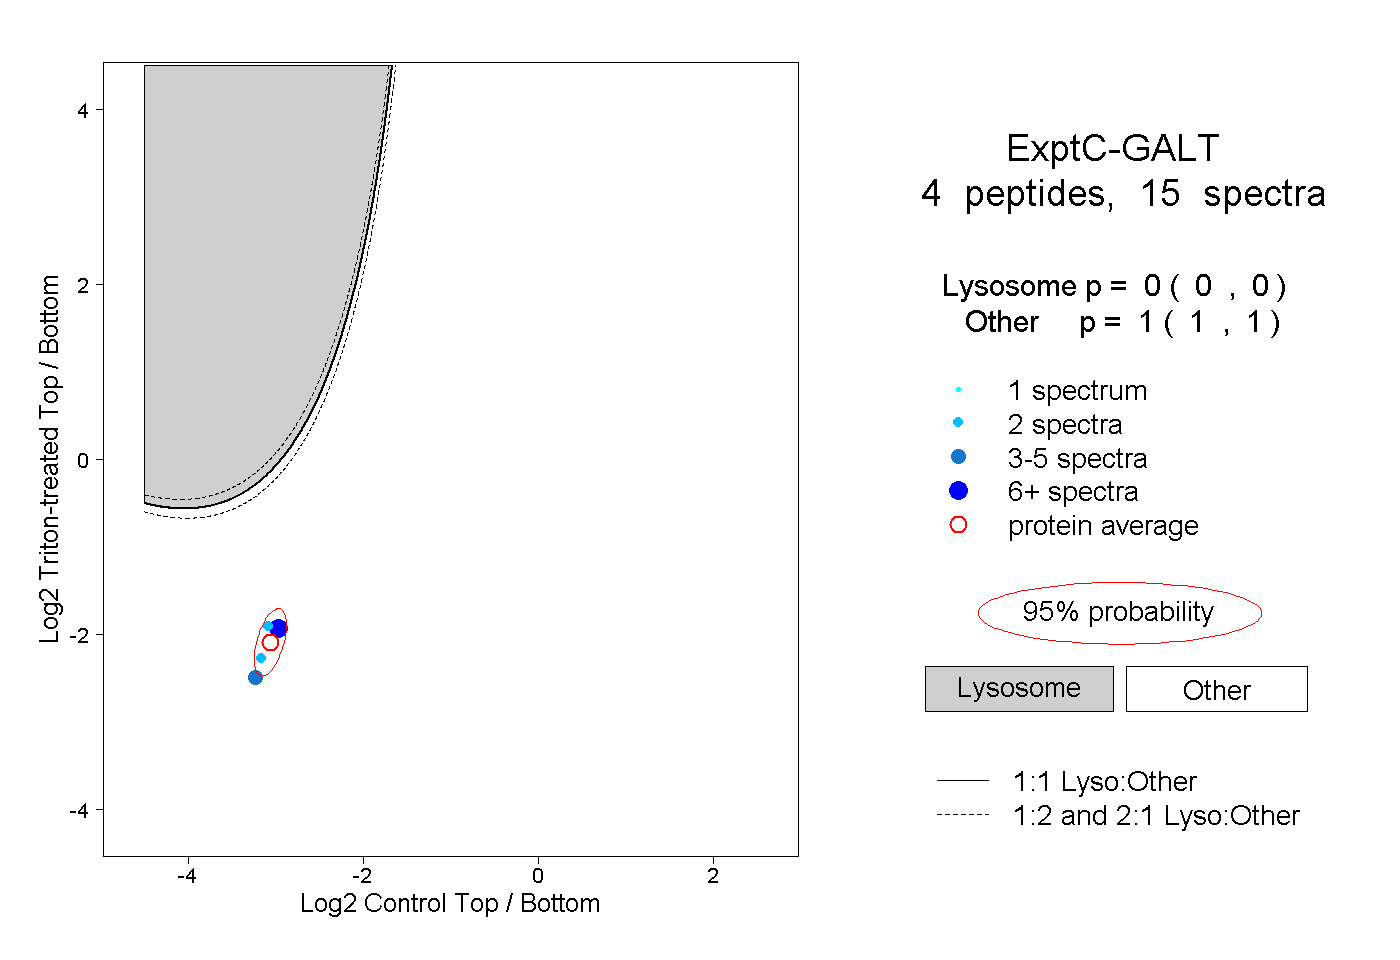 |
0.000 0.000 | 0.000 |
1.000 1.000 | 1.000 |
||||||||
| Plot | Lyso | Other | |||||||||||
| Expt D |
1 peptide |
2 spectra |
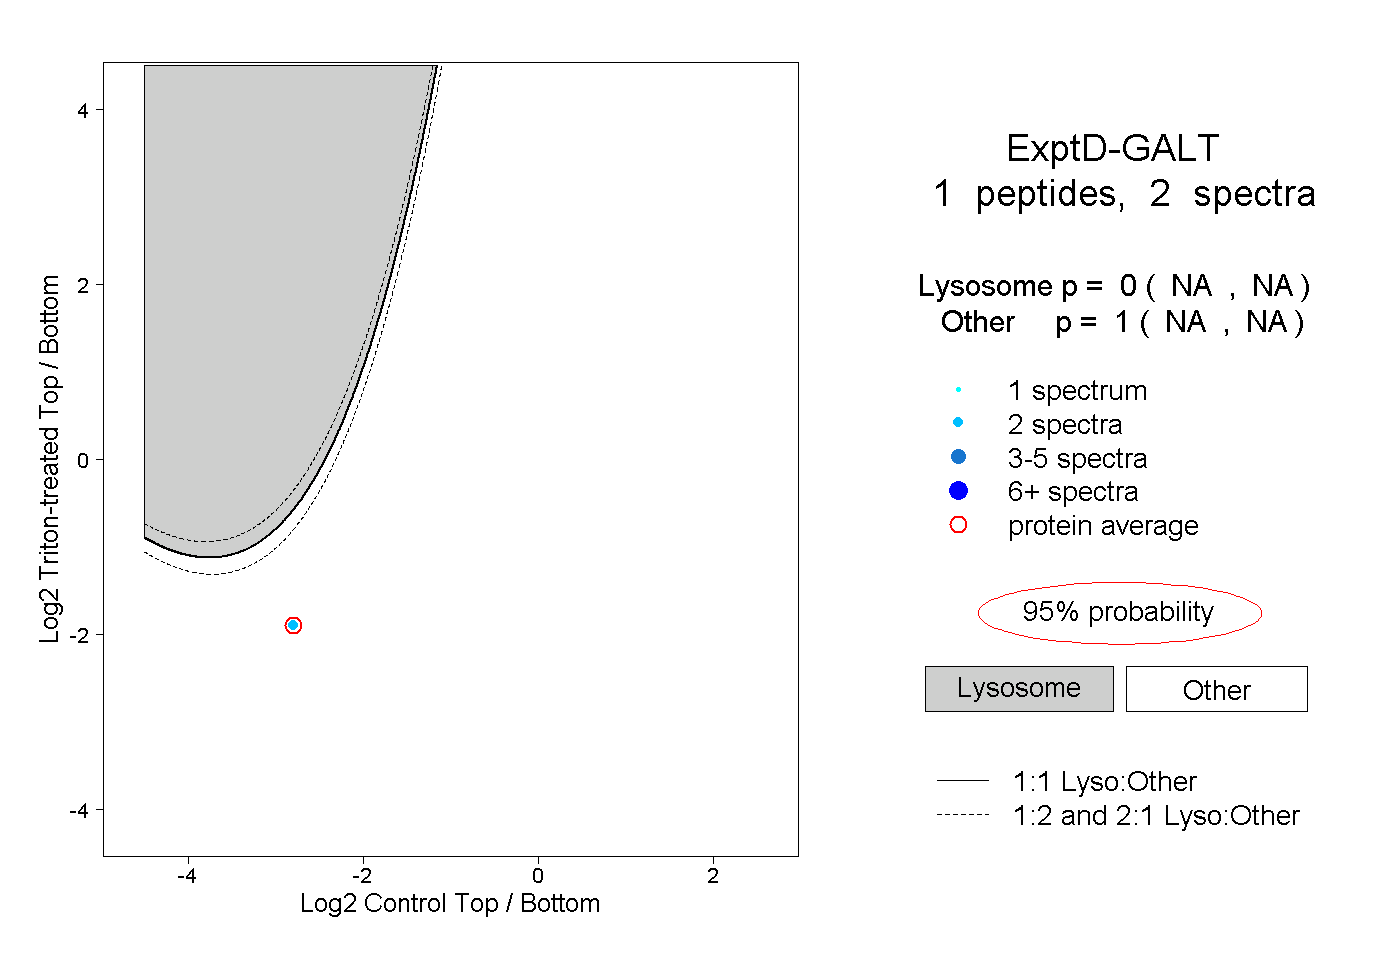 |
0.000 NA | NA |
1.000 NA | NA |