 4
4peptides
spectra
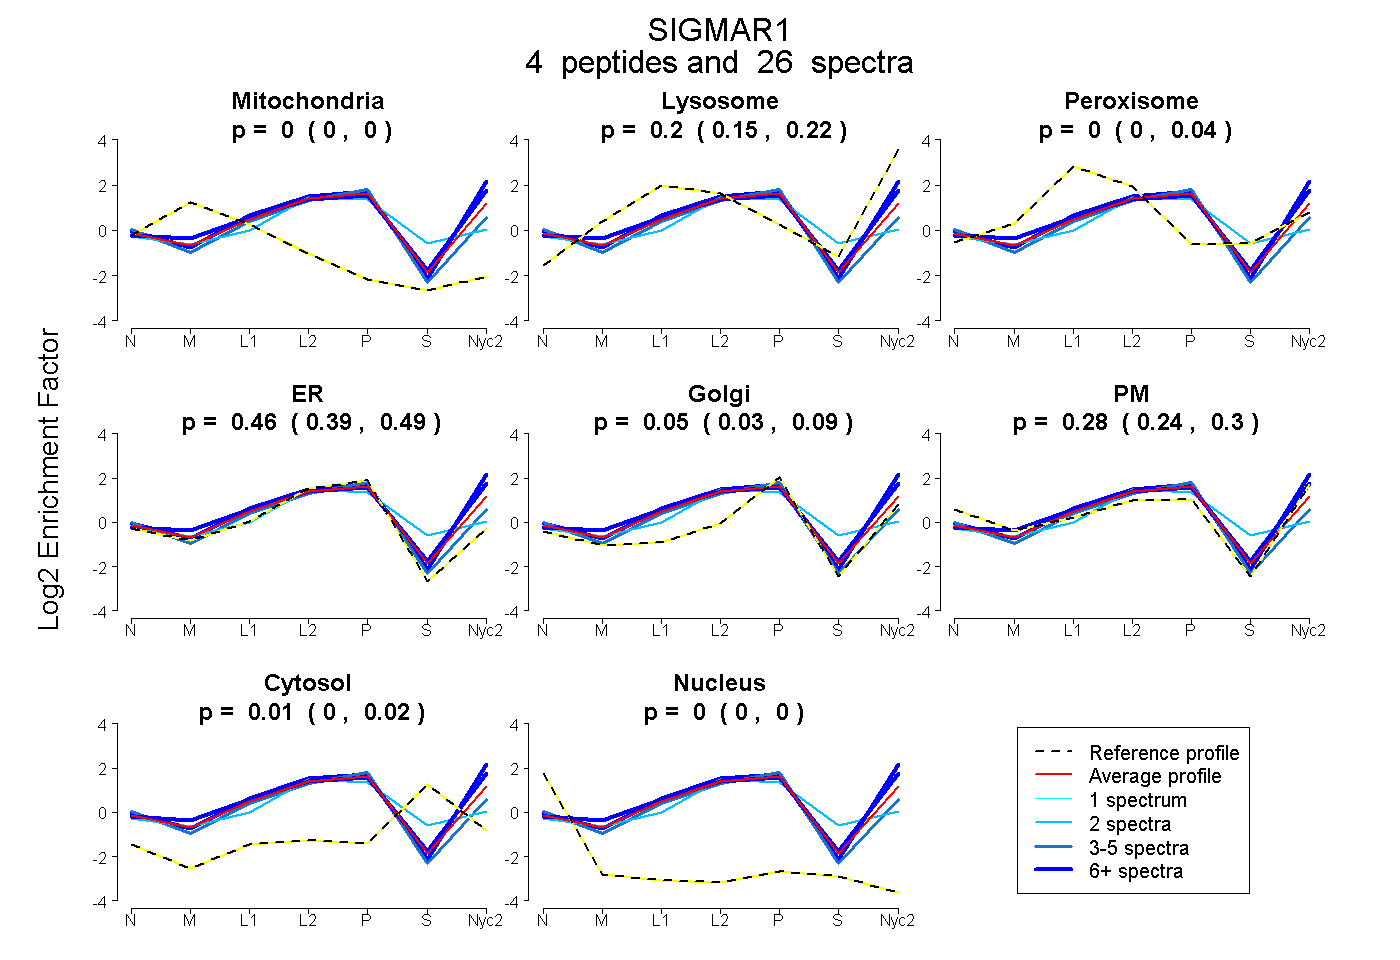
0.000 | 0.000
0.155 | 0.218
0.000 | 0.040
0.389 | 0.486
0.029 | 0.091
0.235 | 0.304
0.000 | 0.023
0.000 | 0.000
2peptides
spectra
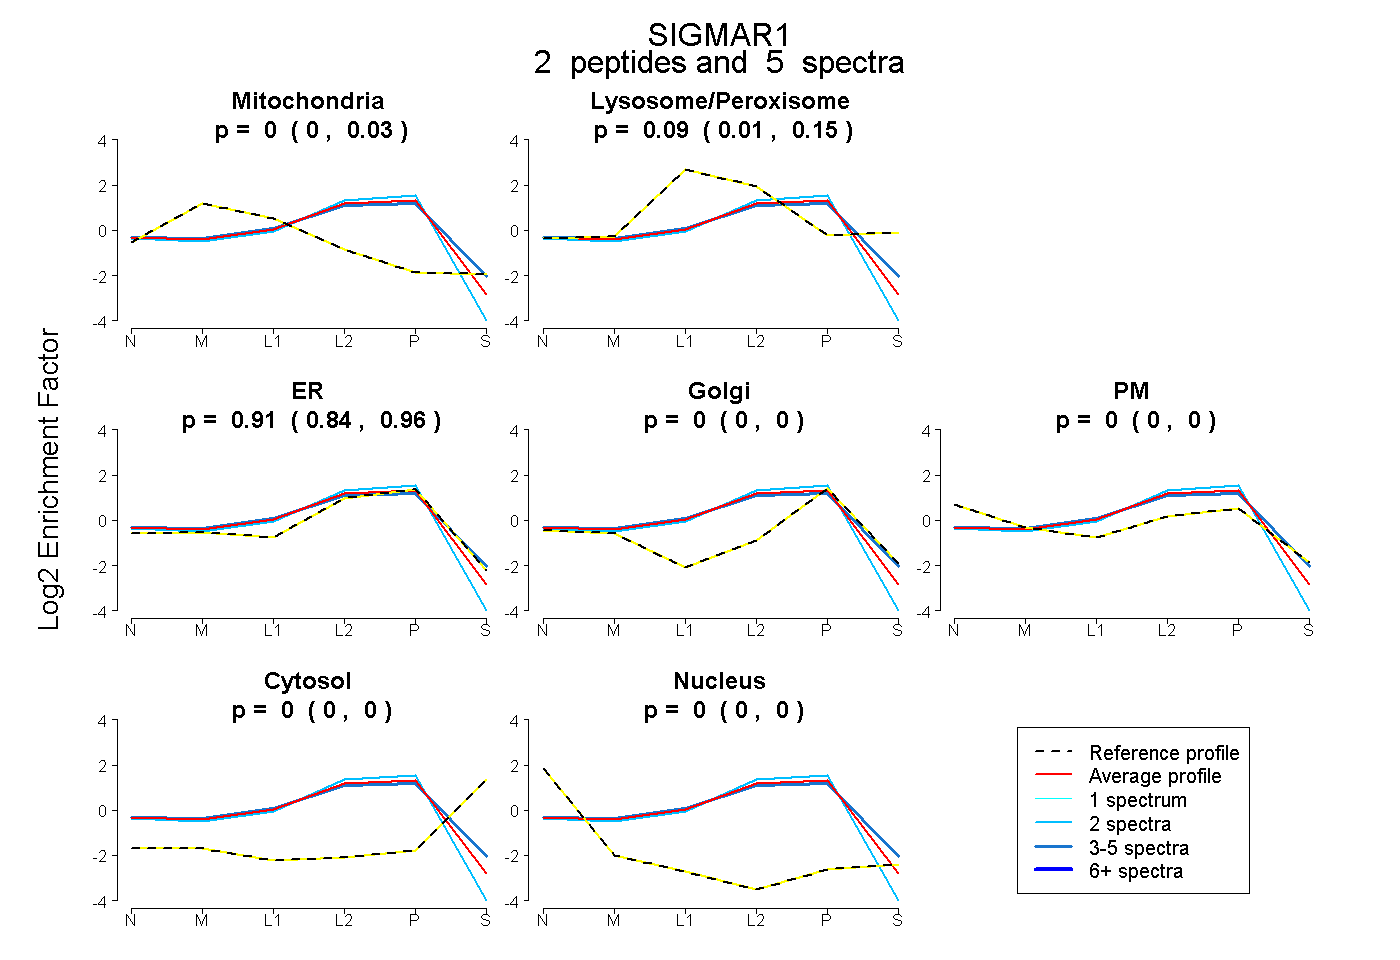
0.000 | 0.035
0.010 | 0.145
0.843 | 0.955
0.000 | 0.000
0.000 | 0.000
0.000 | 0.000
0.000 | 0.000
3peptides
spectra
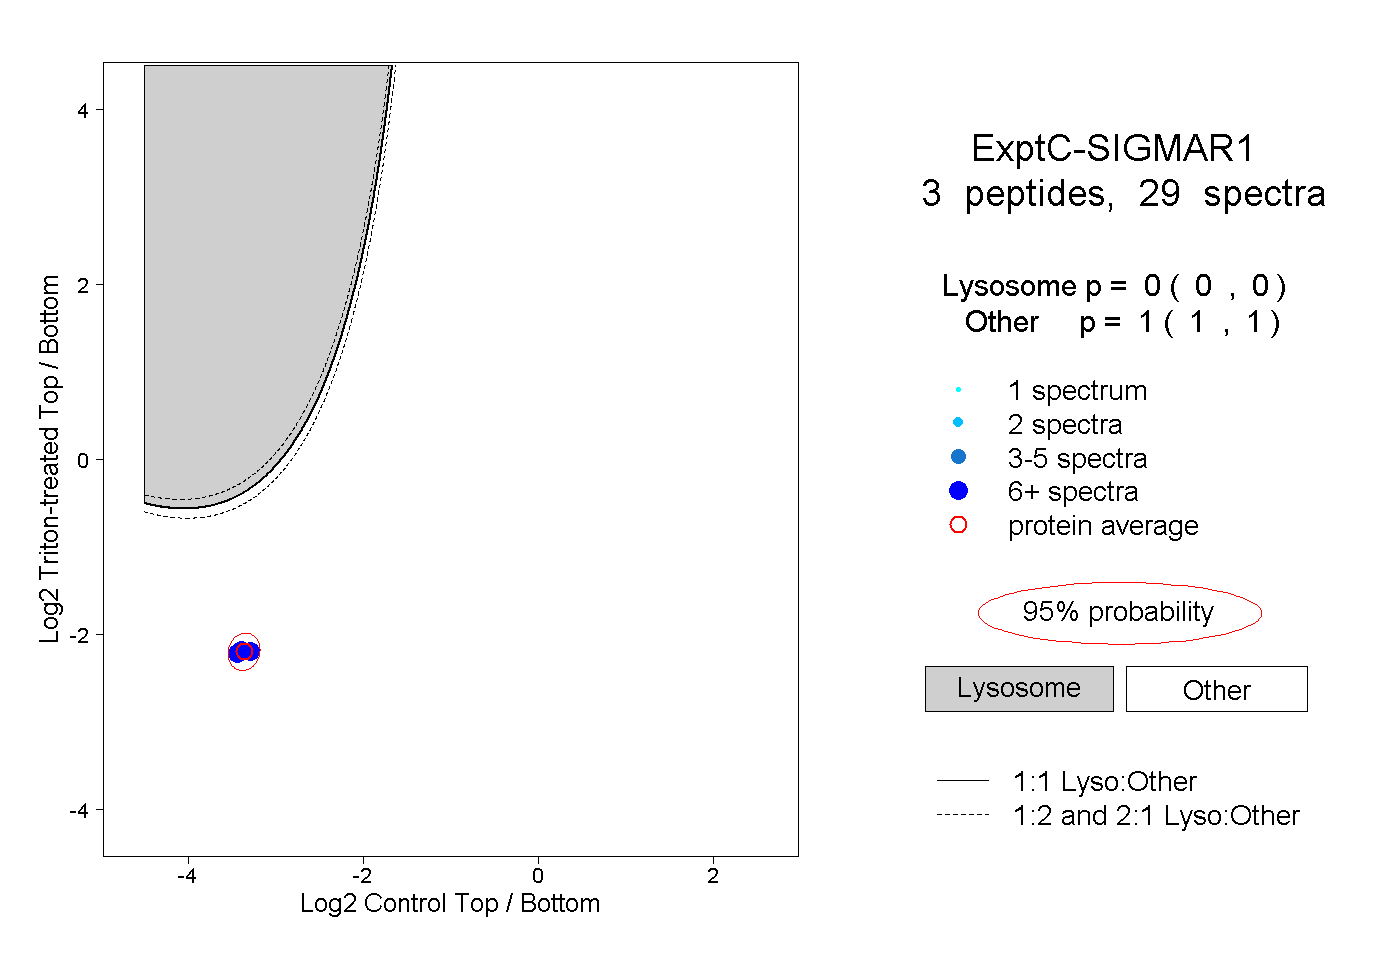
0.000 | 0.000
1.000 | 1.000
1peptide
spectra
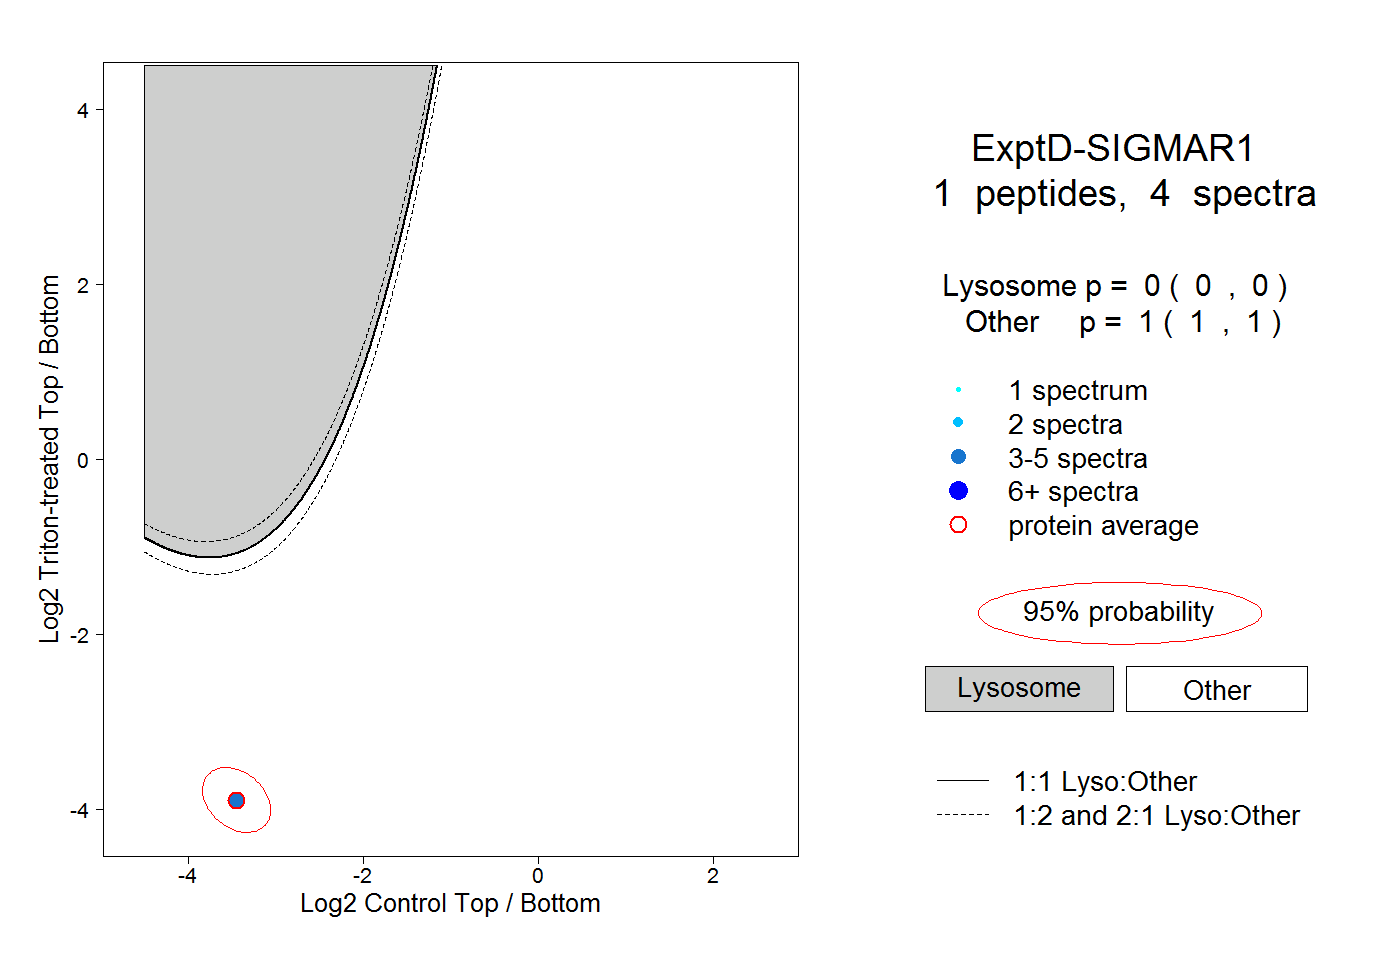
0.000 | 0.000
1.000 | 1.000