 43
43peptides
spectra
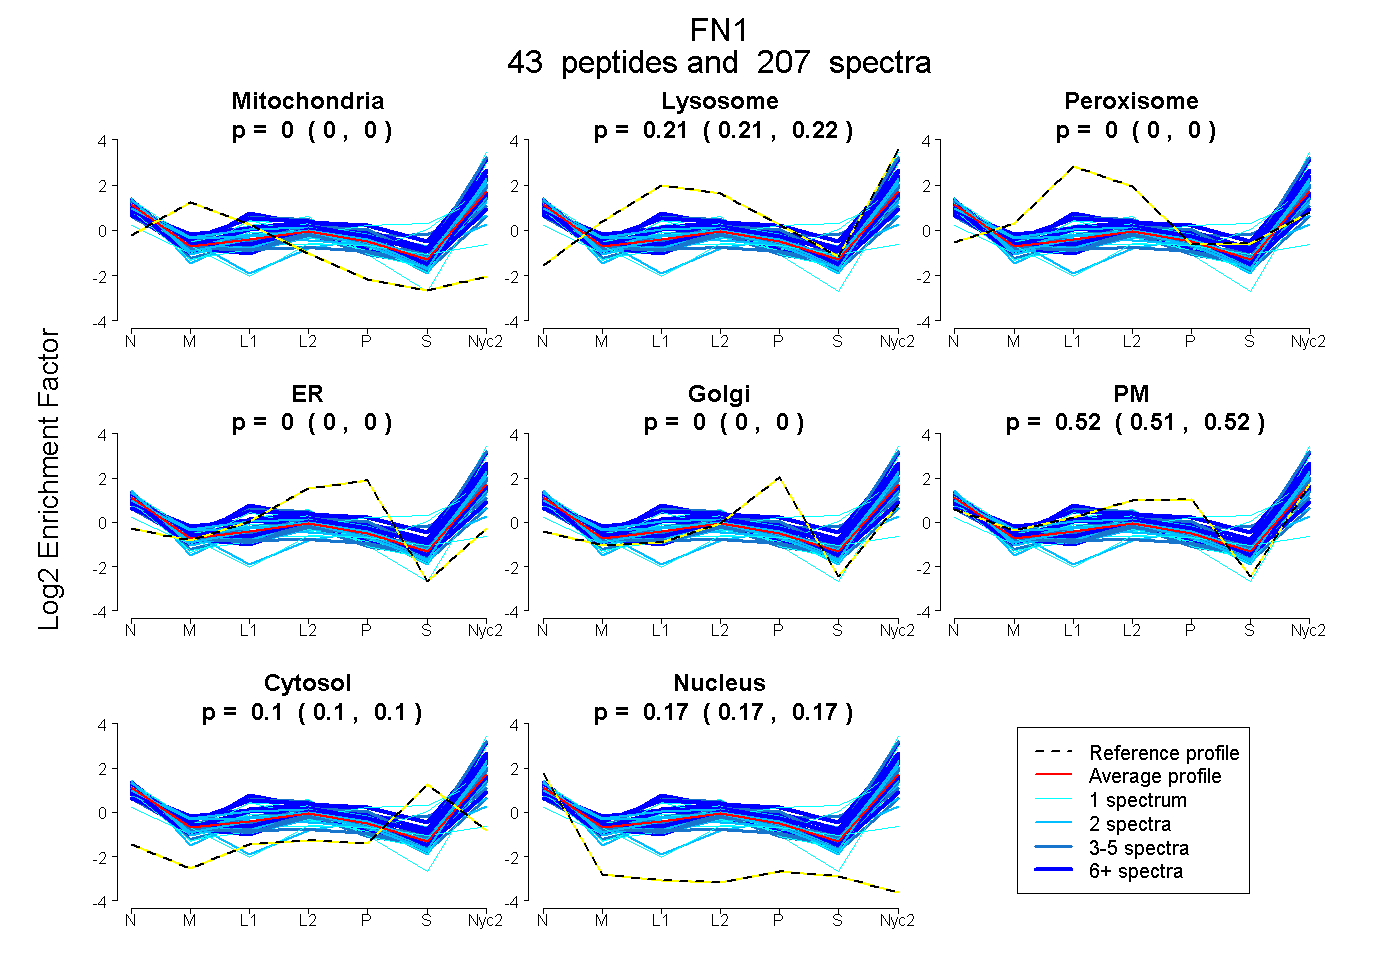
0.000 | 0.000
0.210 | 0.217
0.000 | 0.000
0.000 | 0.000
0.000 | 0.000
0.511 | 0.518
0.096 | 0.101
0.170 | 0.175
18peptides
spectra
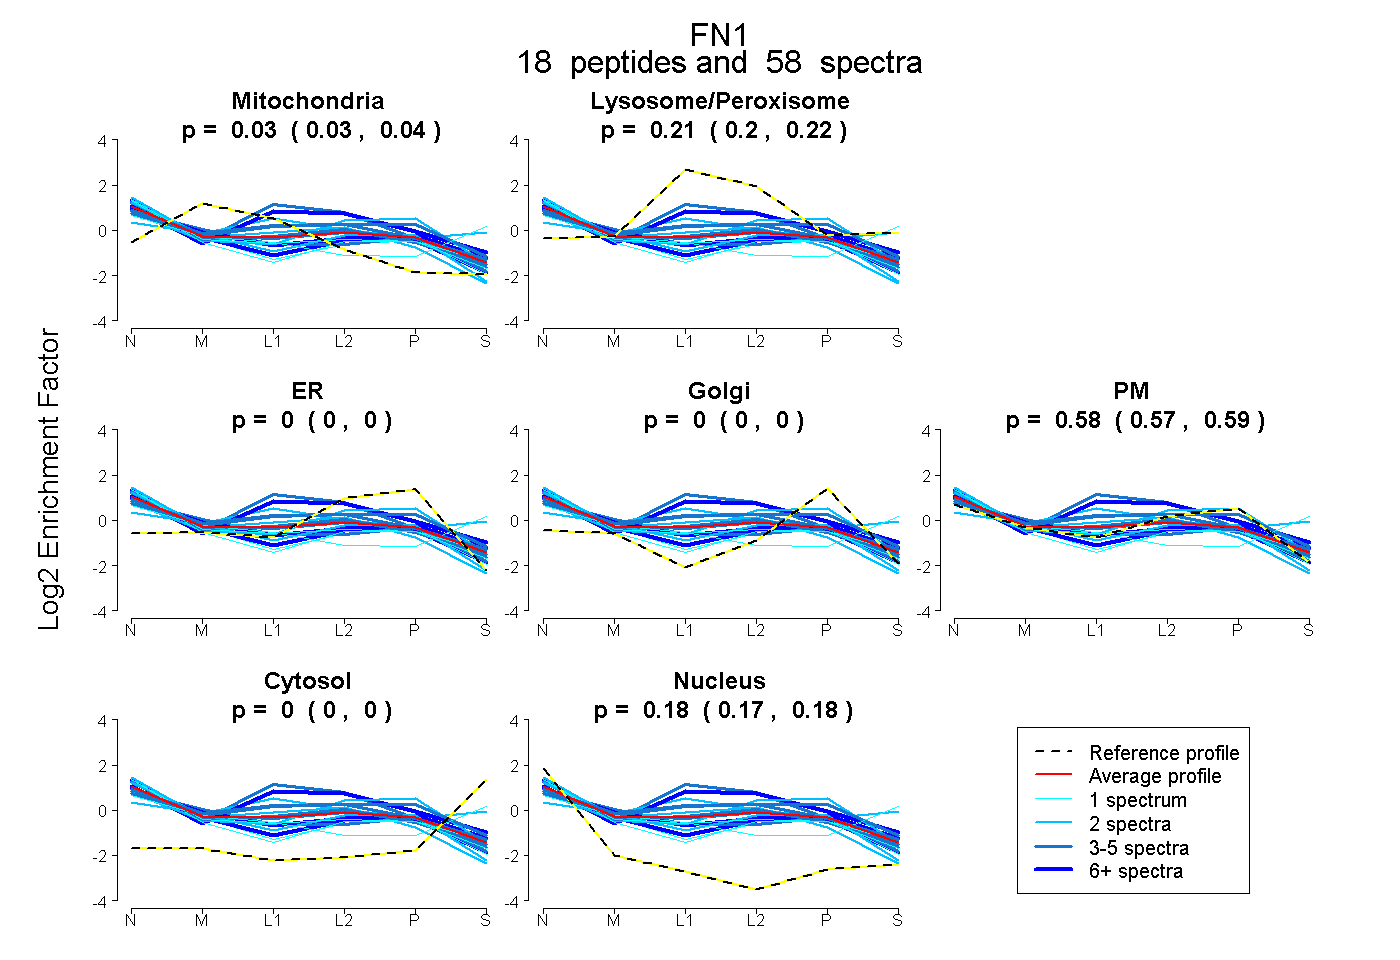
0.028 | 0.040
0.202 | 0.220
0.000 | 0.000
0.000 | 0.000
0.565 | 0.587
0.000 | 0.000
0.171 | 0.180
43peptides
spectra
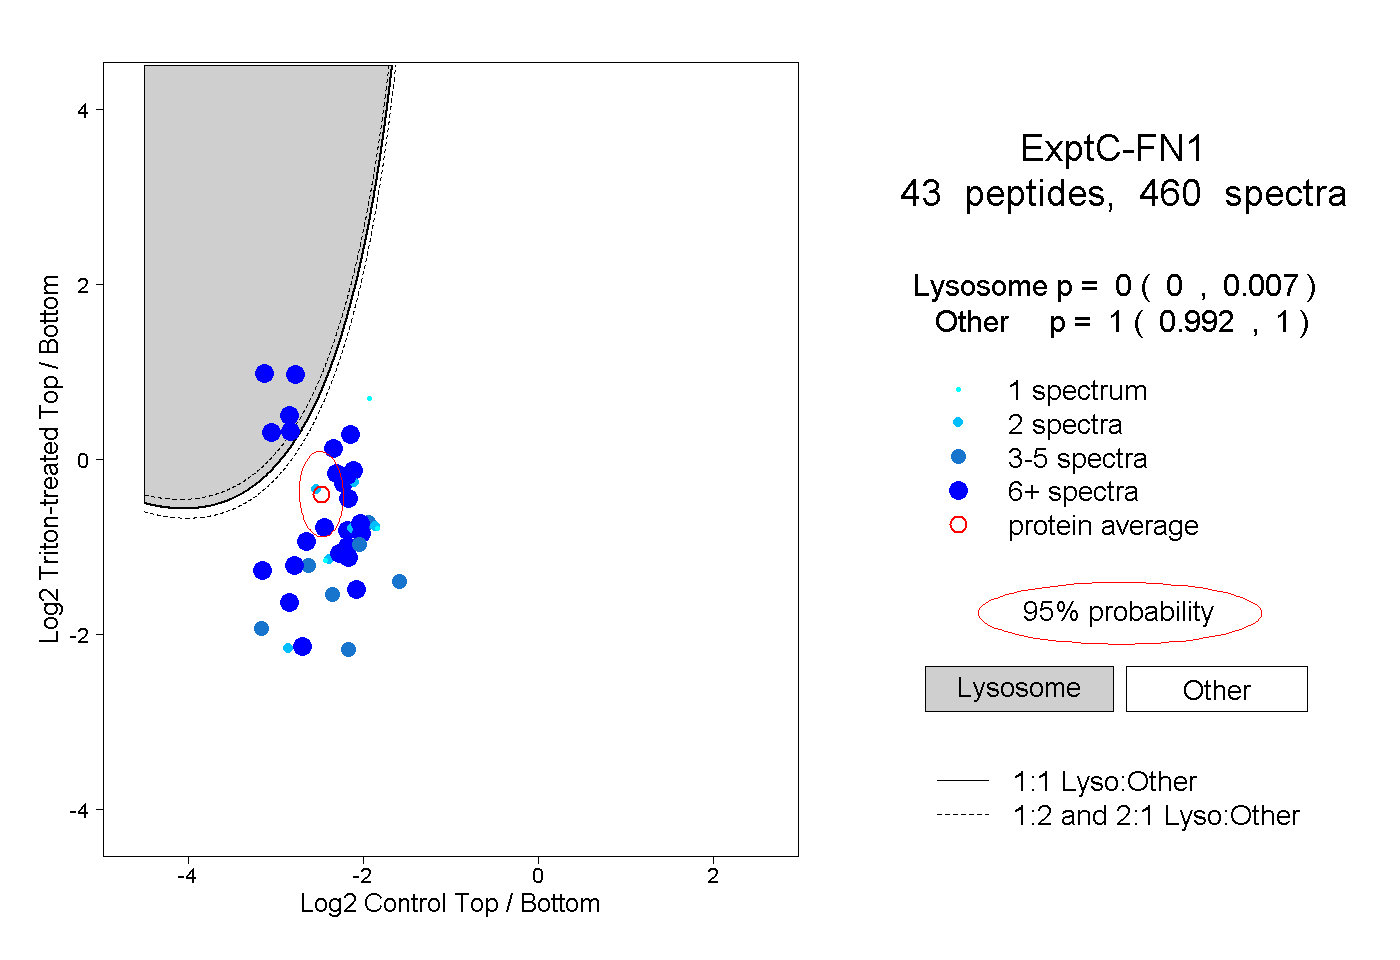
0.000 | 0.007
0.992 | 1.000
20peptides
spectra
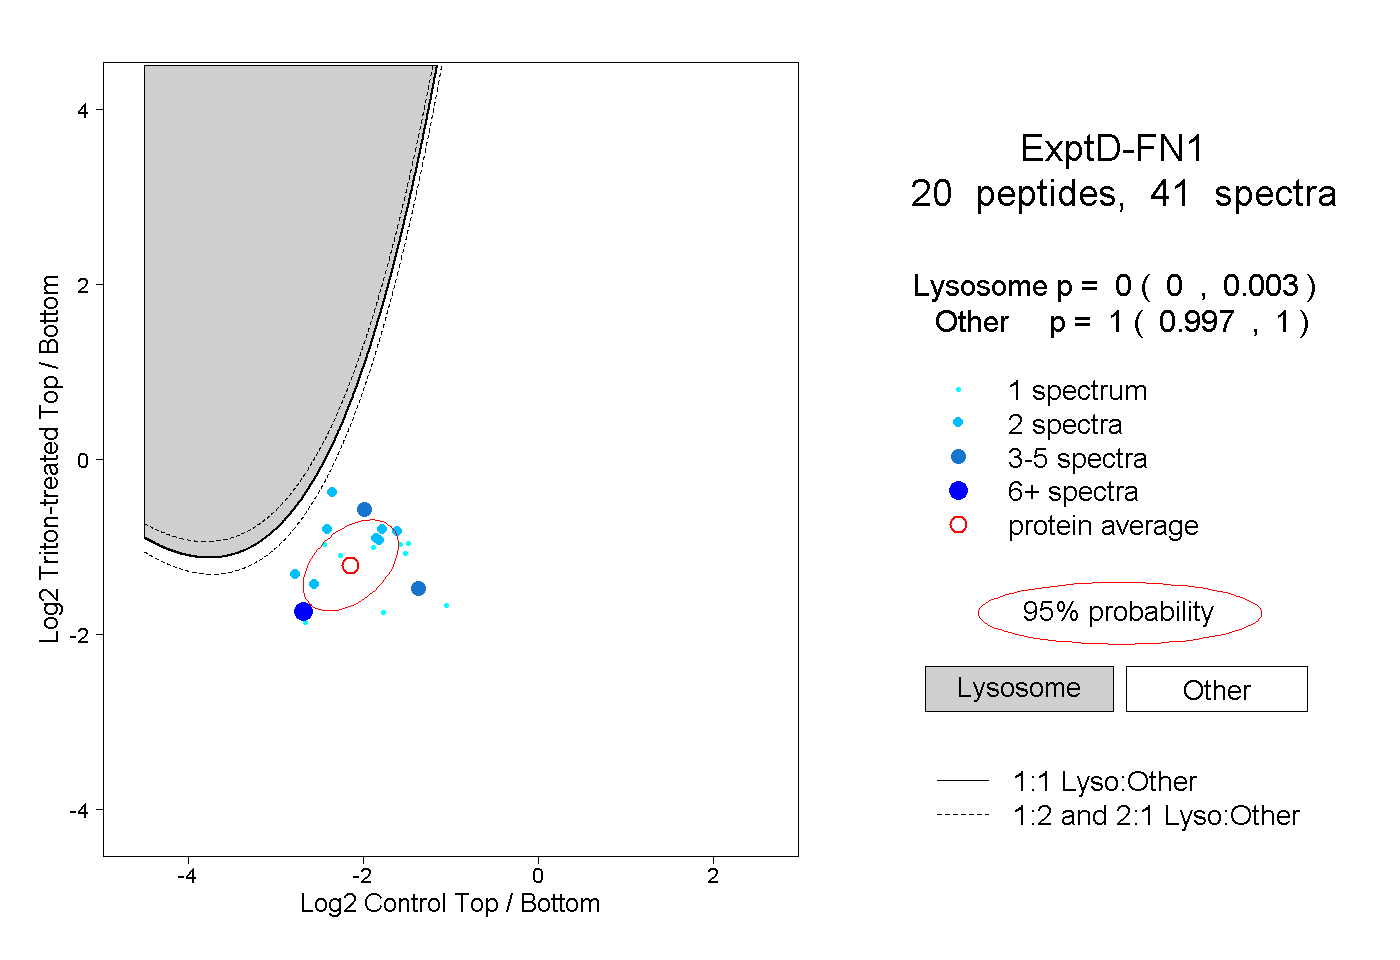
0.000 | 0.003
0.997 | 1.000