 8
8peptides
spectra
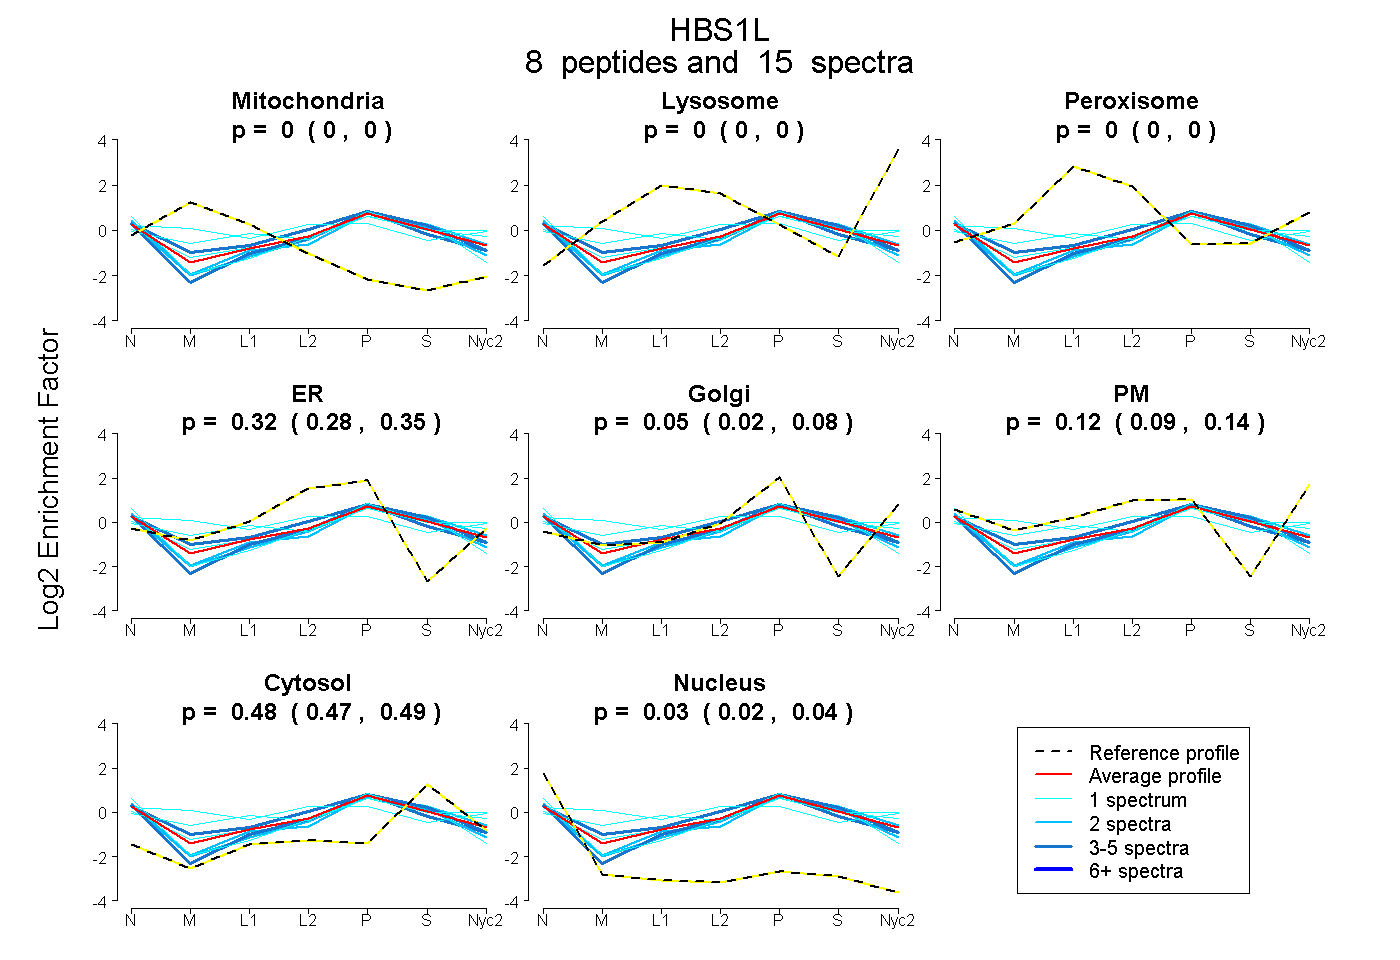
0.000 | 0.000
0.000 | 0.000
0.000 | 0.000
0.277 | 0.346
0.023 | 0.080
0.086 | 0.145
0.470 | 0.489
0.024 | 0.039
| Plot | Mito | Lyso | Perox | ER | Golgi | PM | Cytosol | Nucleus | |||||
| Expt A |
8 peptides |
15 spectra |
|
0.000 0.000 | 0.000 |
0.000 0.000 | 0.000 |
0.000 0.000 | 0.000 |
0.316 0.277 | 0.346 |
0.054 0.023 | 0.080 |
0.117 0.086 | 0.145 |
0.480 0.470 | 0.489 |
0.032 0.024 | 0.039 |
| 4 spectra, LGHFLK | 0.000 | 0.000 | 0.000 | 0.320 | 0.102 | 0.000 | 0.530 | 0.048 | ||
| 1 spectrum, LCVSDVFK | 0.016 | 0.000 | 0.000 | 0.414 | 0.000 | 0.000 | 0.530 | 0.040 | ||
| 3 spectra, EHGLLVR | 0.000 | 0.000 | 0.029 | 0.466 | 0.000 | 0.053 | 0.407 | 0.045 | ||
| 1 spectrum, SLGVTQLAVAVNK | 0.038 | 0.000 | 0.219 | 0.000 | 0.410 | 0.000 | 0.332 | 0.000 | ||
| 1 spectrum, LISVLNK | 0.134 | 0.000 | 0.108 | 0.088 | 0.000 | 0.382 | 0.287 | 0.000 | ||
| 2 spectra, GEFEAGFETGGQTR | 0.000 | 0.000 | 0.000 | 0.334 | 0.085 | 0.000 | 0.491 | 0.091 | ||
| 2 spectra, IEAGYVQTGDR | 0.000 | 0.000 | 0.000 | 0.203 | 0.205 | 0.033 | 0.523 | 0.036 | ||
| 1 spectrum, STGEVTK | 0.000 | 0.000 | 0.000 | 0.000 | 0.227 | 0.266 | 0.453 | 0.055 |
| Plot | Mito | Lyso or Perox | ER | Golgi | PM | Cytosol | Nucleus | ||||||
| Expt B |
1 peptide |
1 spectrum |
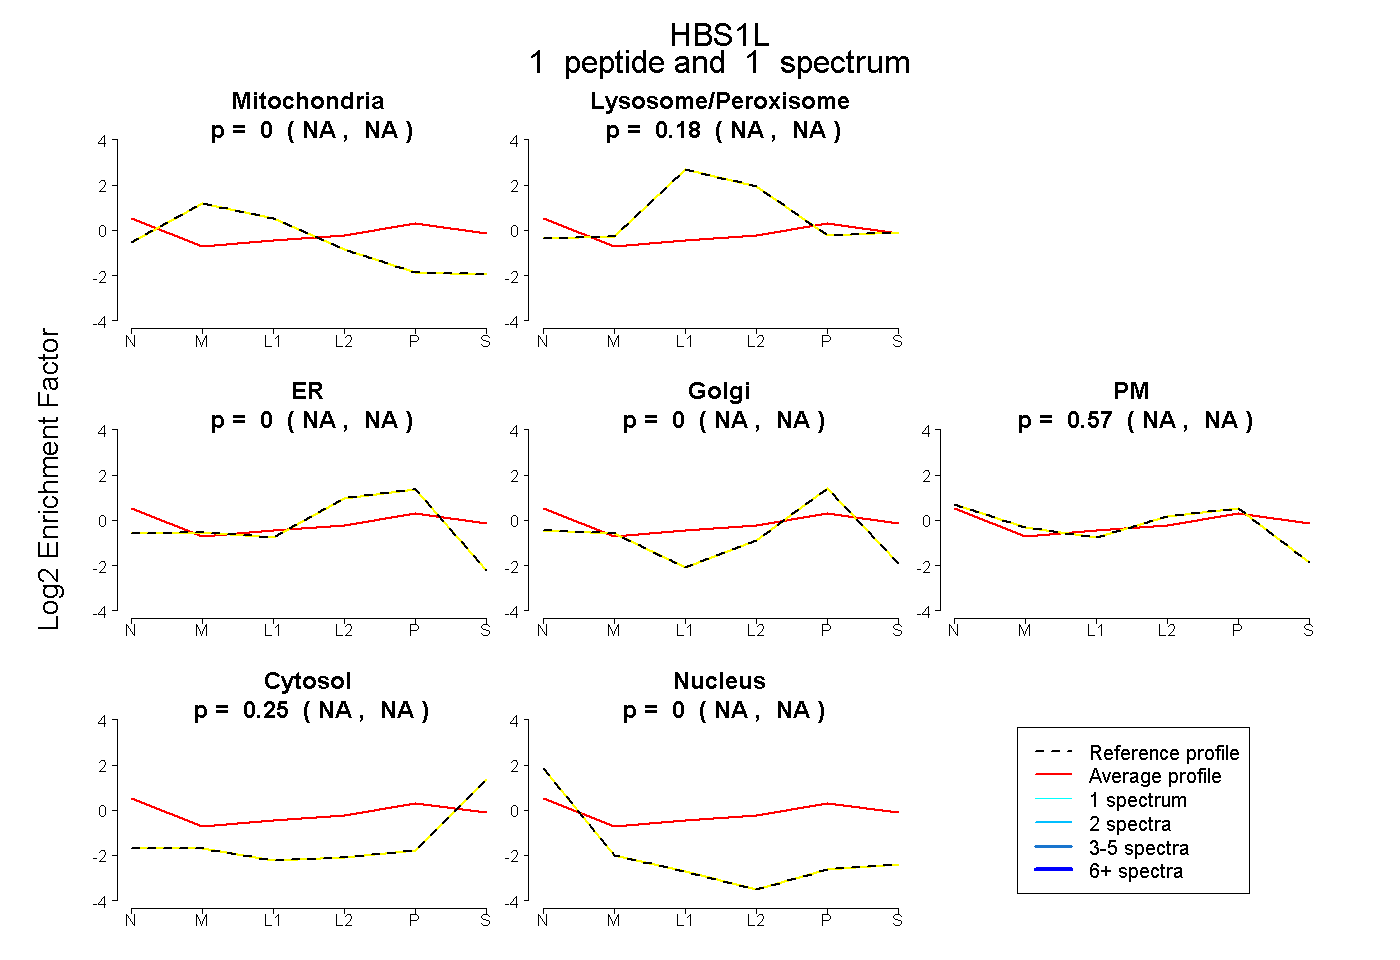 |
0.000 NA | NA |
0.182 NA | NA |
0.000 NA | NA |
0.000 NA | NA |
0.572 NA | NA |
0.246 NA | NA |
0.000 NA | NA |
|||
| Plot | Lyso | Other | |||||||||||
| Expt C |
11 peptides |
23 spectra |
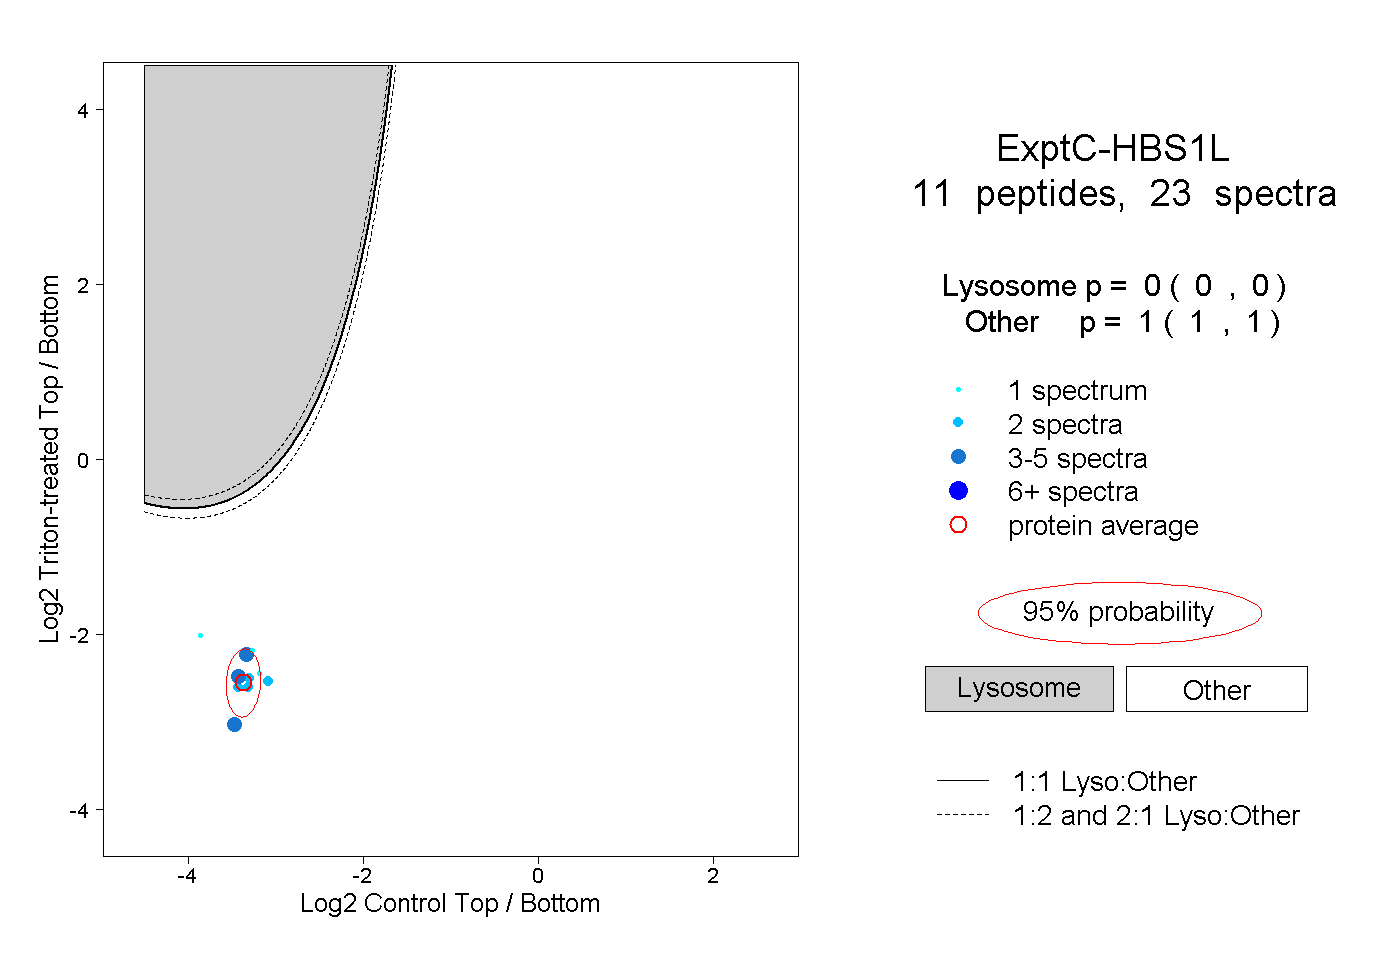 |
0.000 0.000 | 0.000 |
1.000 1.000 | 1.000 |