6
6peptides
spectra
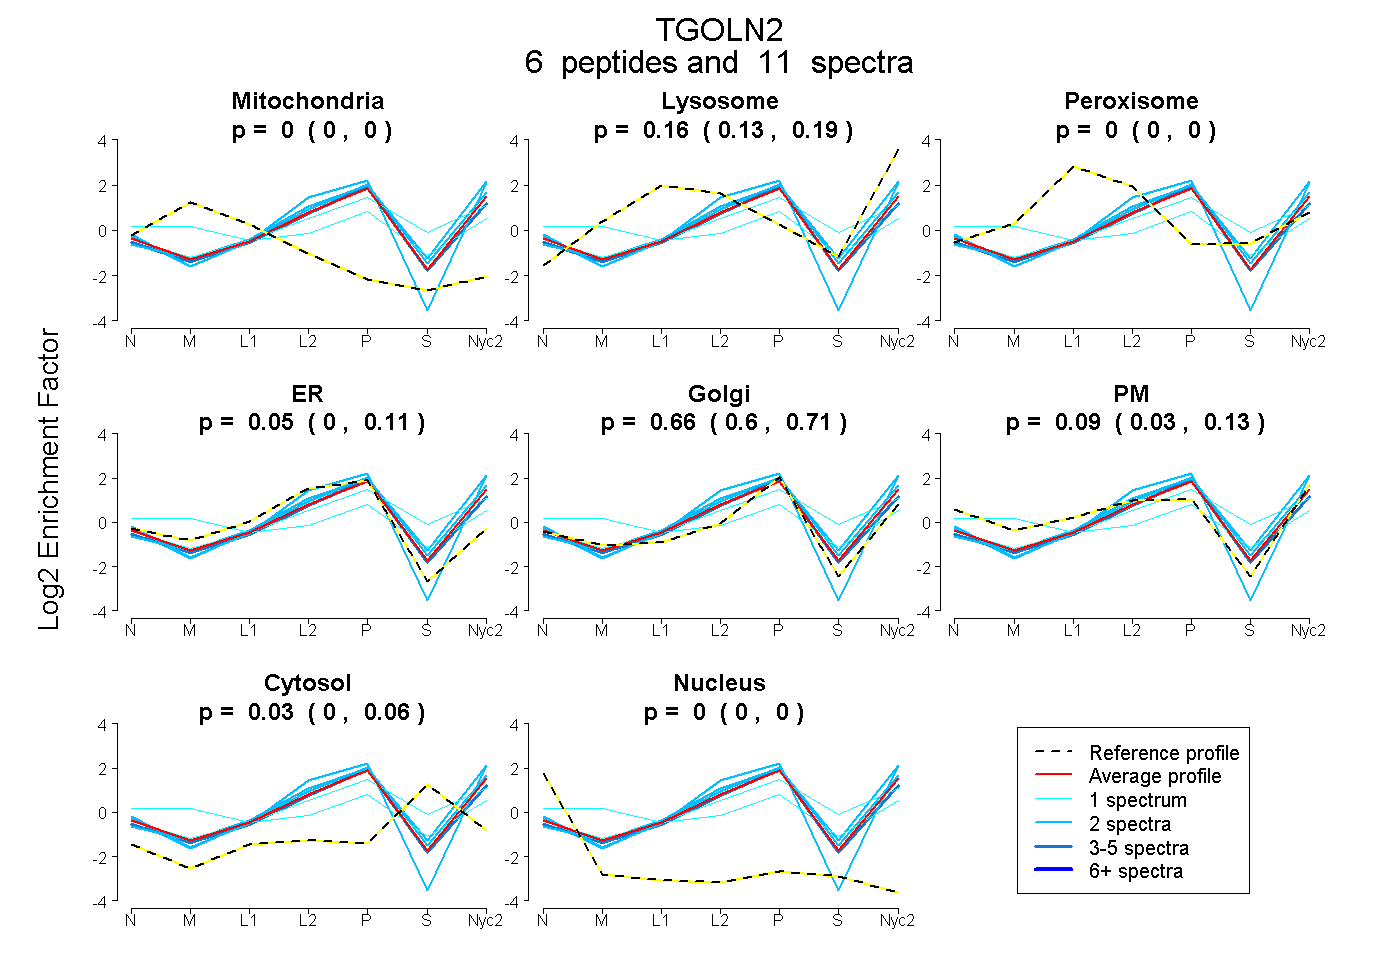
0.000 | 0.000
0.133 | 0.189
0.000 | 0.000
0.000 | 0.108
0.598 | 0.708
0.031 | 0.133
0.002 | 0.059
0.000 | 0.000
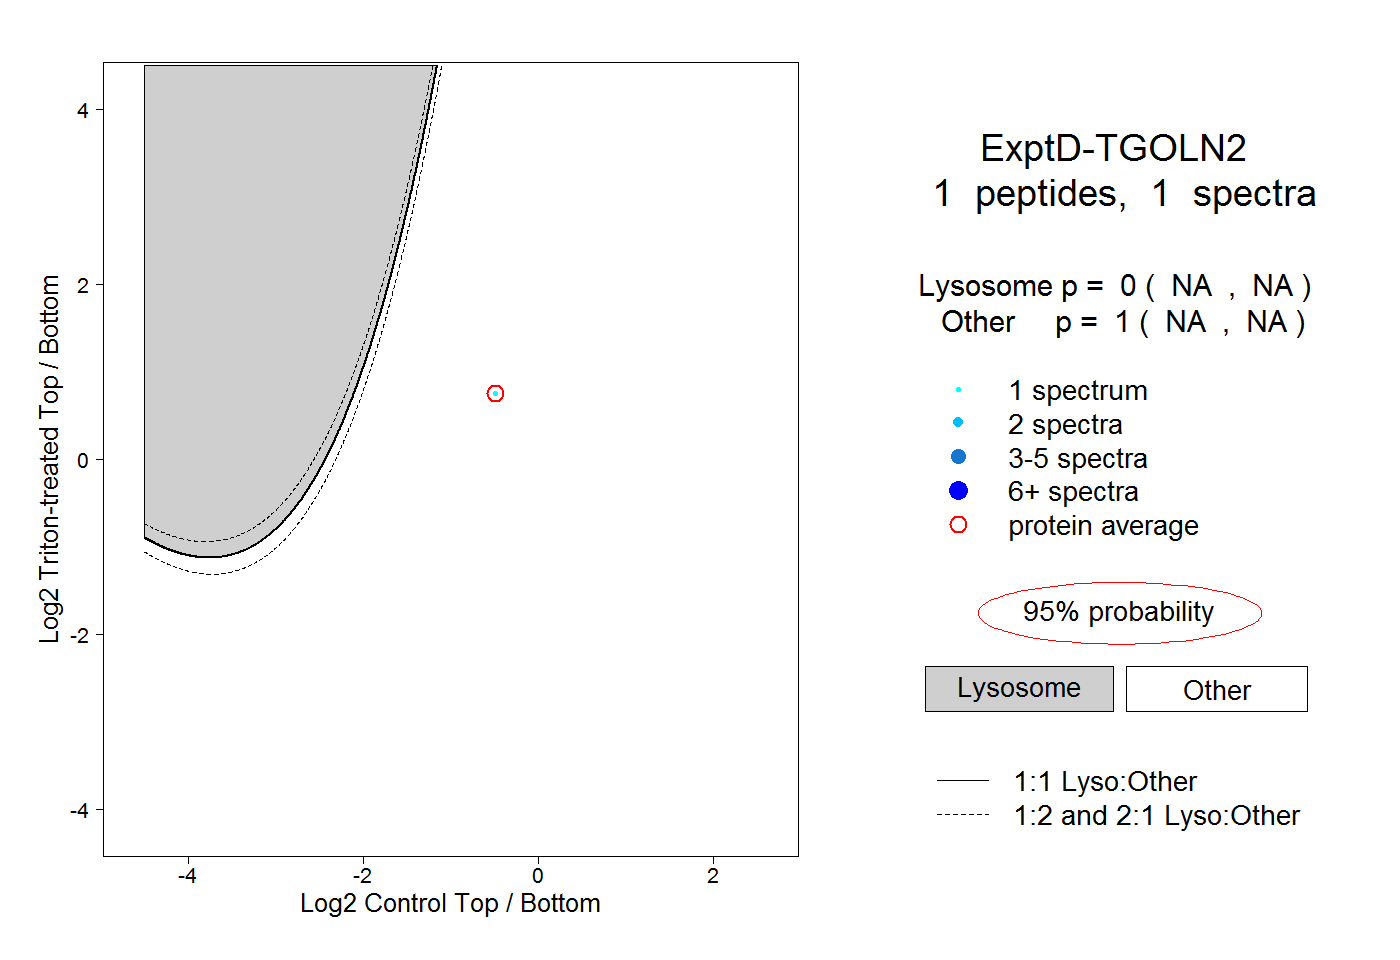
1peptide
spectra
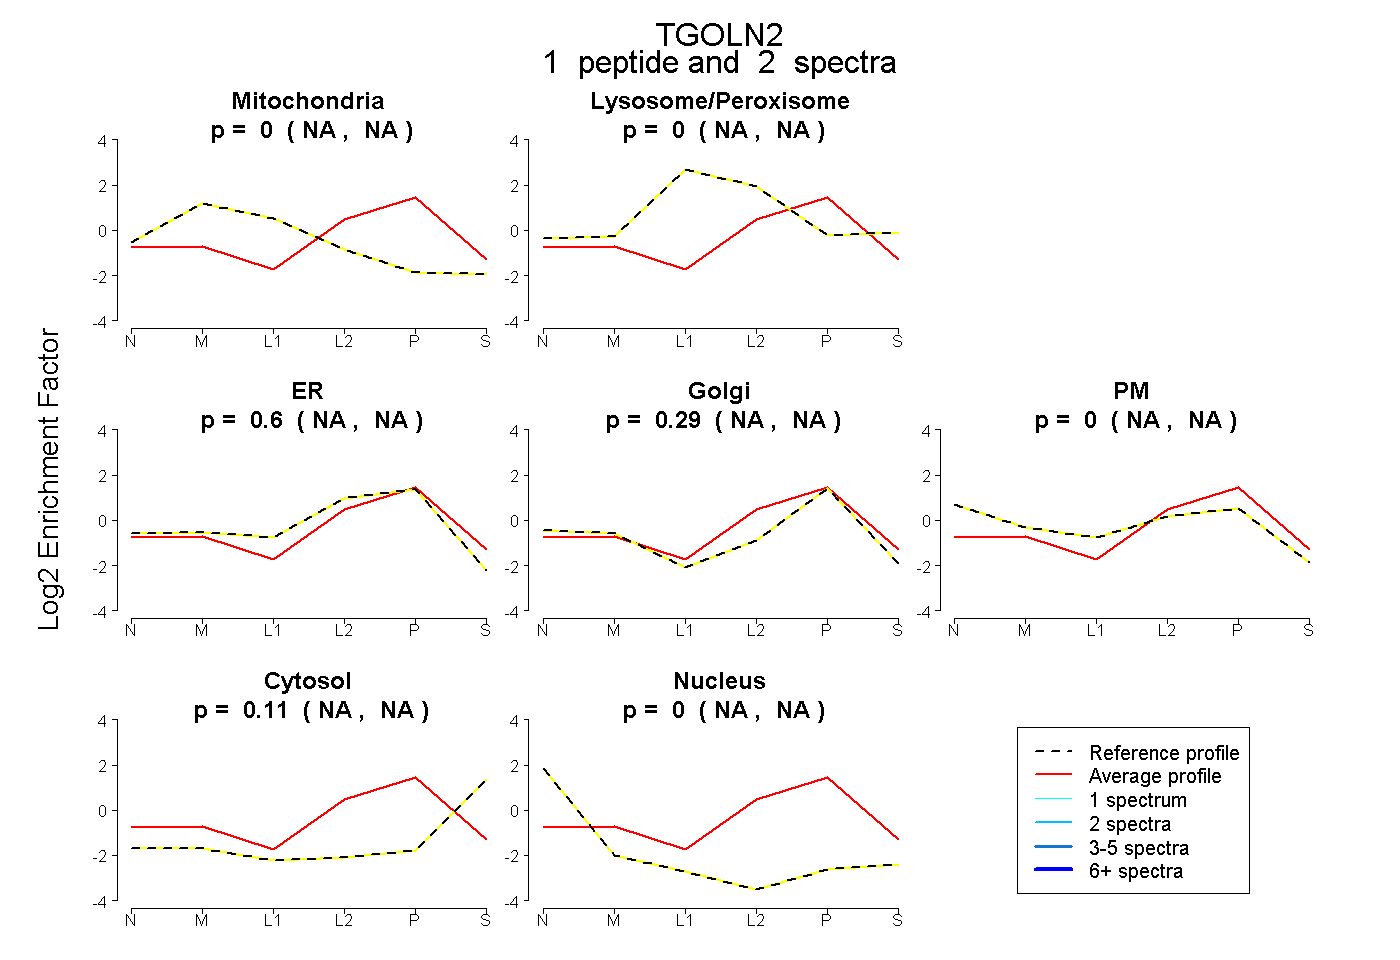
NA | NA
NA | NA
NA | NA
NA | NA
NA | NA
NA | NA
NA | NA
9peptides
spectra
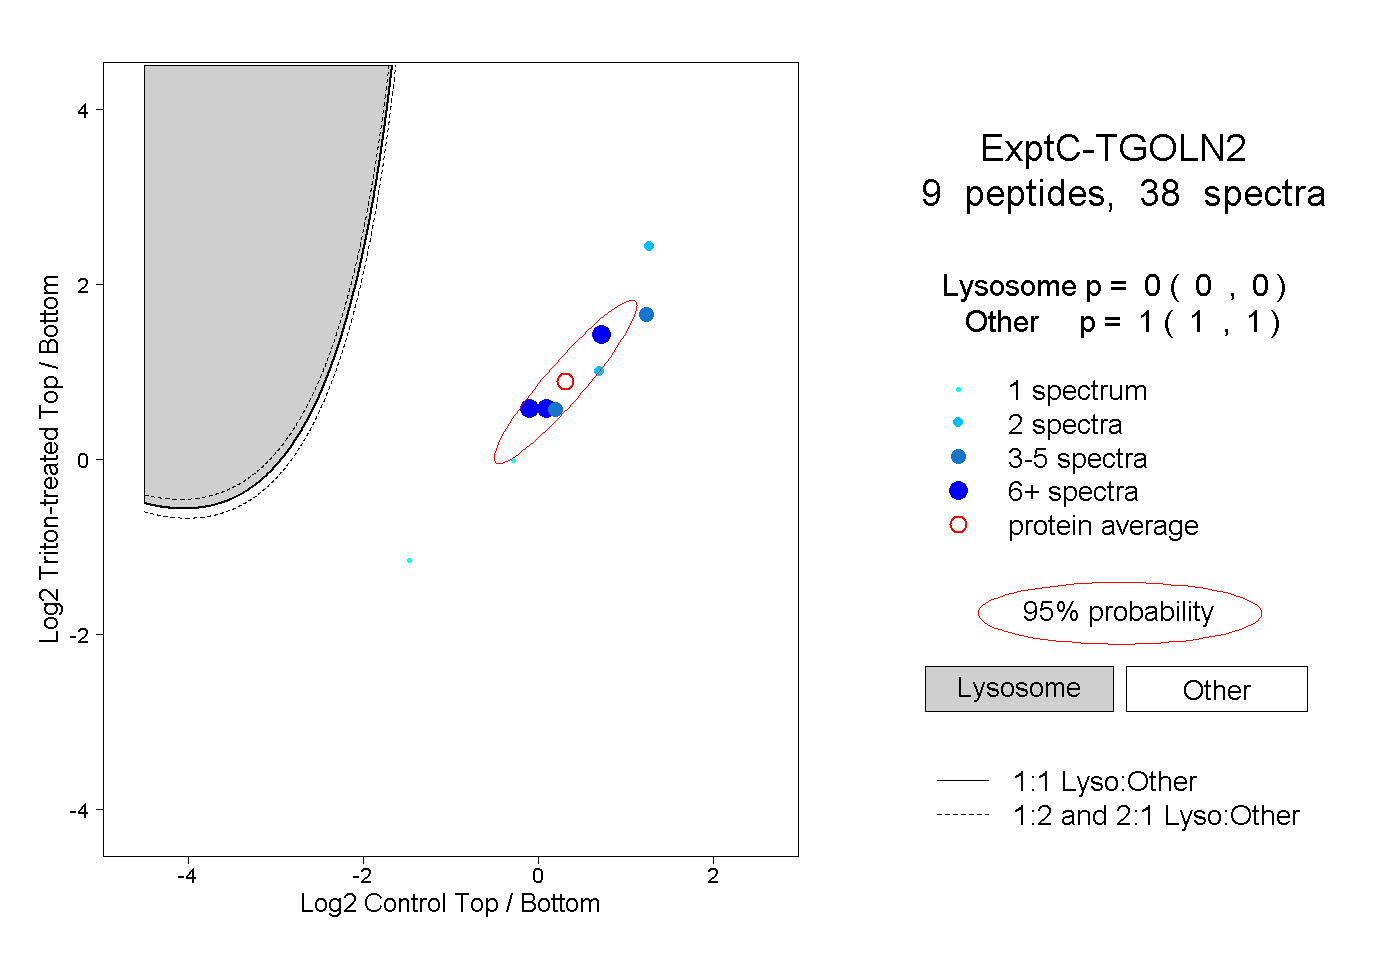
0.000 | 0.000
1.000 | 1.000