 3
3peptides
spectra
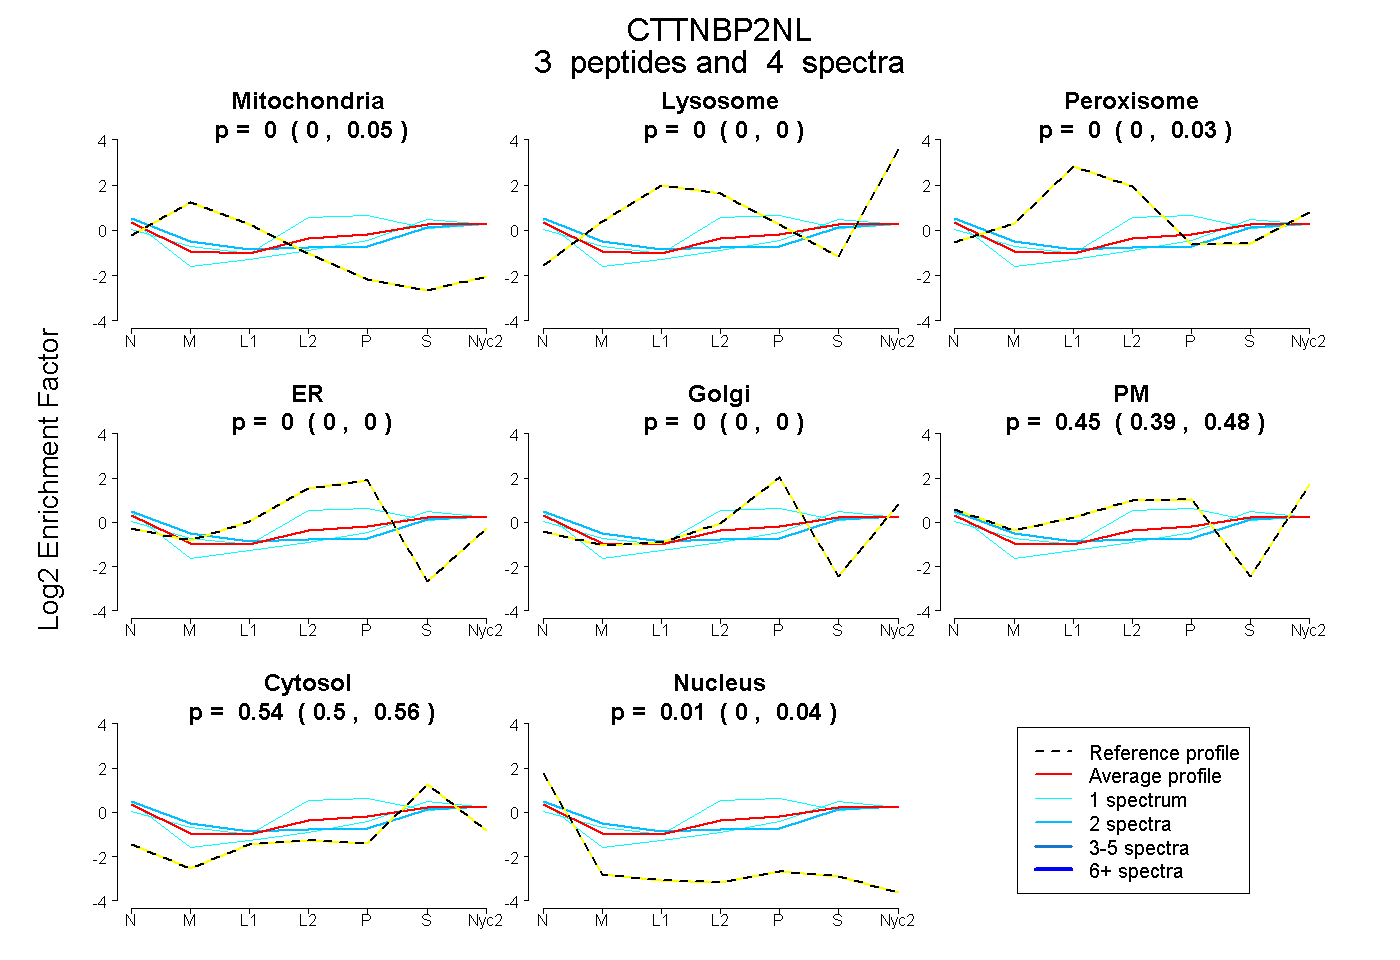
0.000 | 0.051
0.000 | 0.000
0.000 | 0.035
0.000 | 0.000
0.000 | 0.000
0.390 | 0.477
0.497 | 0.560
0.000 | 0.036
1peptide
spectrum
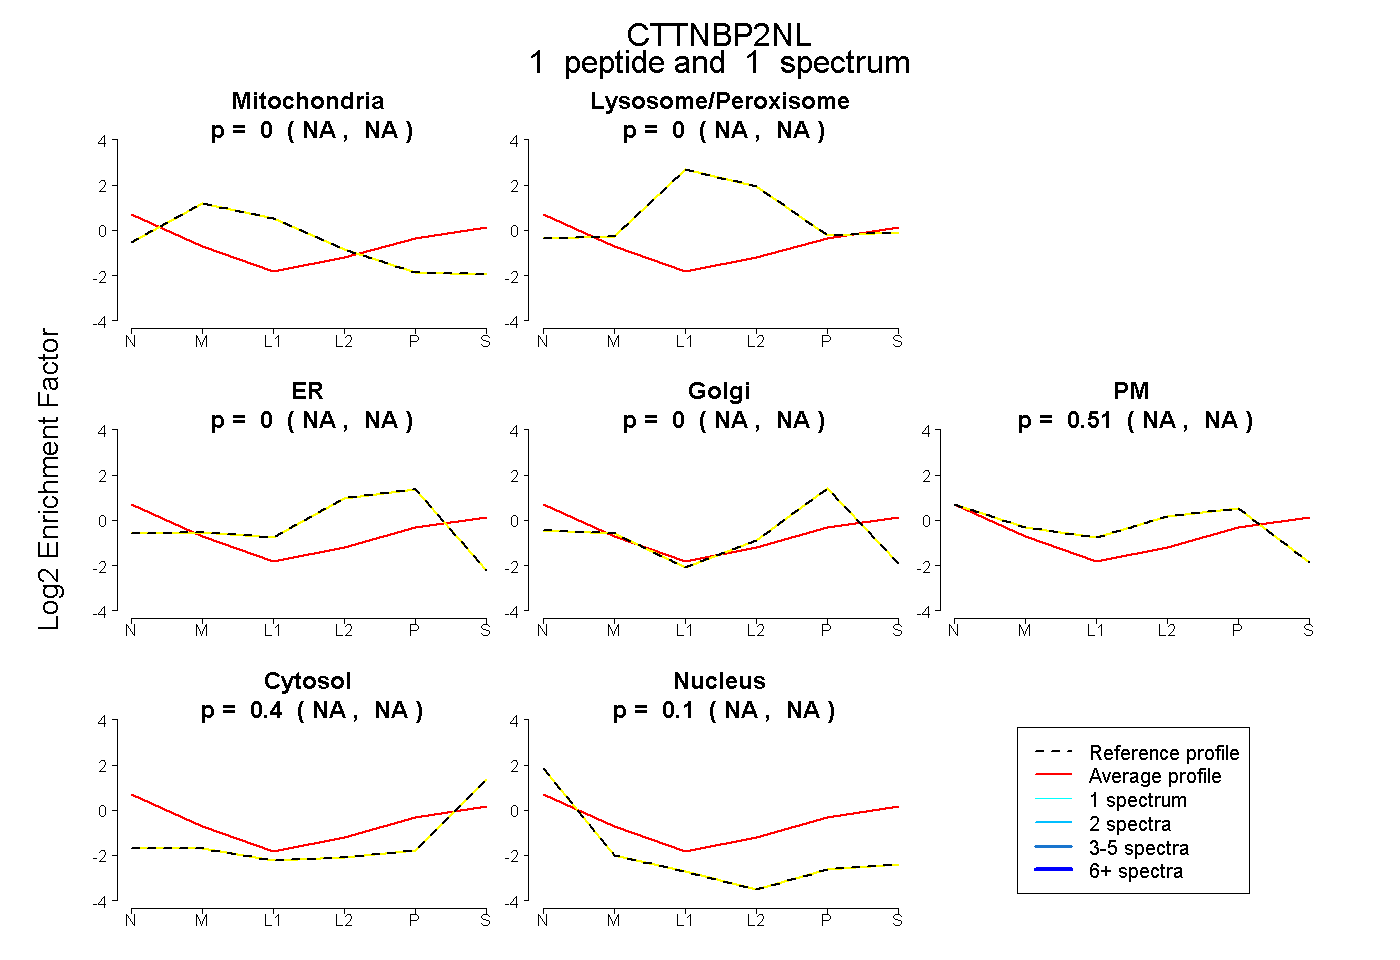
NA | NA
NA | NA
NA | NA
NA | NA
NA | NA
NA | NA
NA | NA
1peptide
spectrum

NA | NA
NA | NA