 4
4peptides
spectra
0.000 | 0.000
0.000 | 0.000
0.100 | 0.146
0.846 | 0.896
0.000 | 0.000
0.000 | 0.000
0.000 | 0.000
0.000 | 0.000
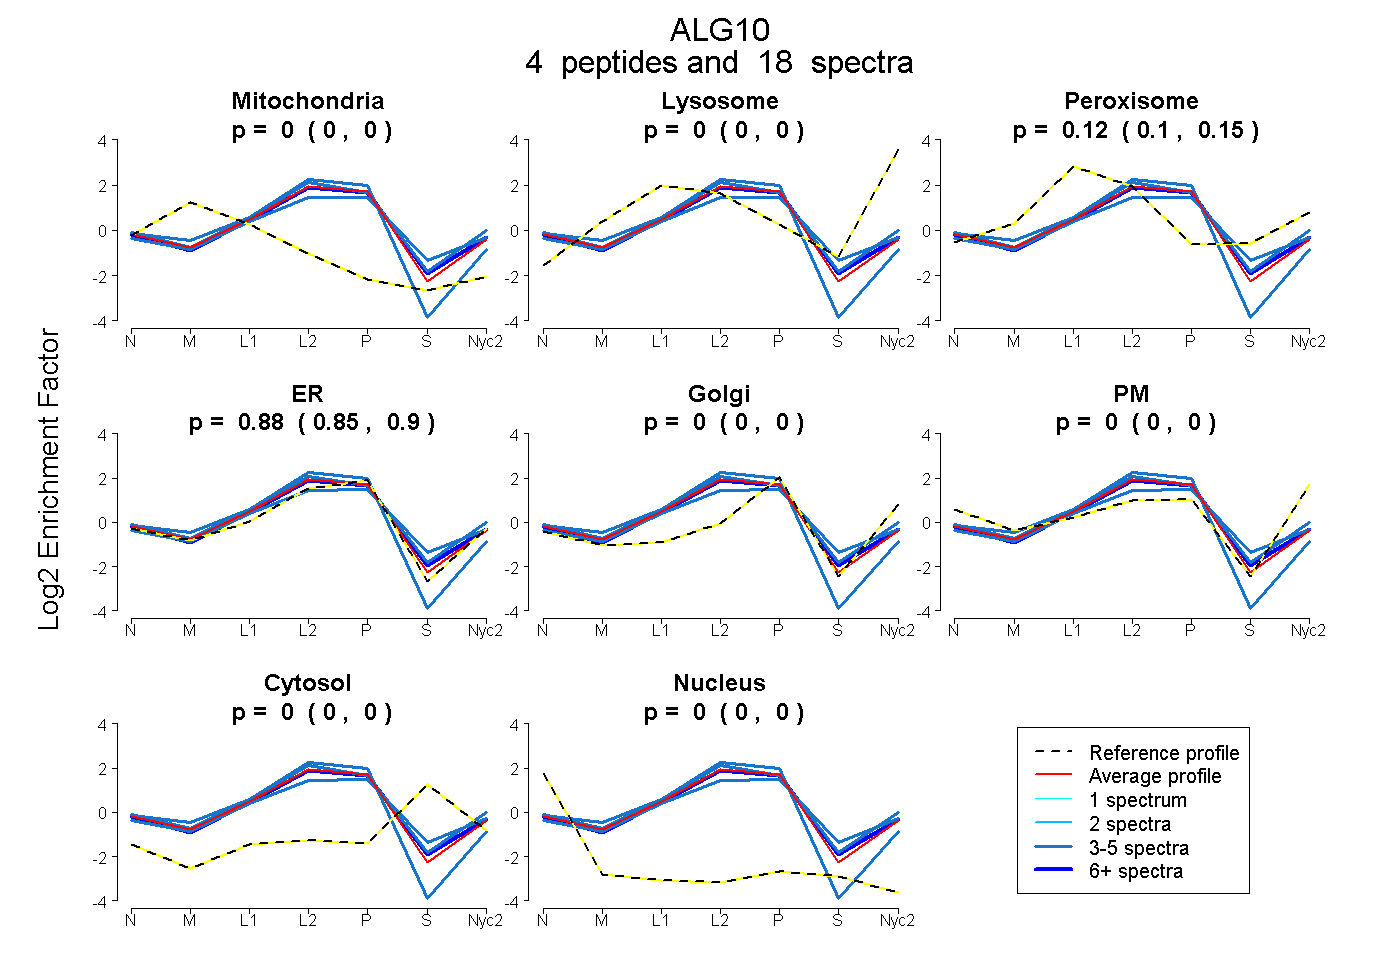
| Plot | Mito | Lyso | Perox | ER | Golgi | PM | Cytosol | Nucleus | |||||
| Expt A |
4 peptides |
18 spectra |
|
0.000 0.000 | 0.000 |
0.000 0.000 | 0.000 |
0.124 0.100 | 0.146 |
0.876 0.846 | 0.896 |
0.000 0.000 | 0.000 |
0.000 0.000 | 0.000 |
0.000 0.000 | 0.000 |
0.000 0.000 | 0.000 |
| 4 spectra, LNMPLPPISR | 0.000 | 0.000 | 0.000 | 1.000 | 0.000 | 0.000 | 0.000 | 0.000 | ||
| 3 spectra, EPYMDEIFHLPQAQR | 0.000 | 0.000 | 0.173 | 0.706 | 0.000 | 0.000 | 0.121 | 0.000 | ||
| 3 spectra, TFLSLVWK | 0.000 | 0.000 | 0.223 | 0.777 | 0.000 | 0.000 | 0.000 | 0.000 | ||
| 8 spectra, ASSSIQR | 0.000 | 0.000 | 0.142 | 0.835 | 0.000 | 0.000 | 0.022 | 0.000 |
| Plot | Lyso | Other | |||||||||||
| Expt C |
4 peptides |
19 spectra |
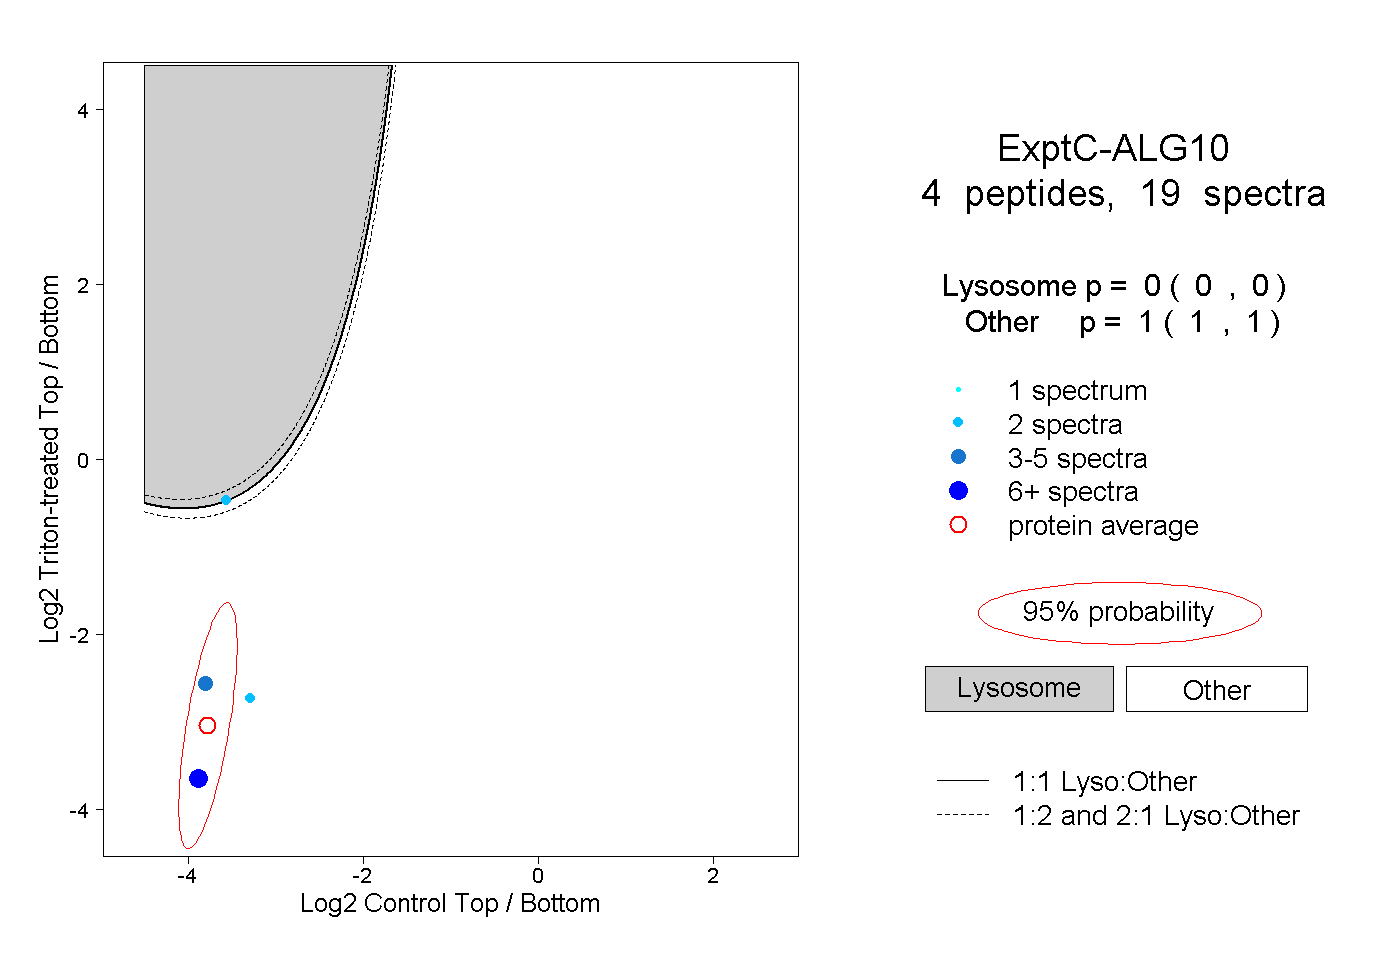 |
0.000 0.000 | 0.000 |
1.000 1.000 | 1.000 |