 5
5peptides
spectra
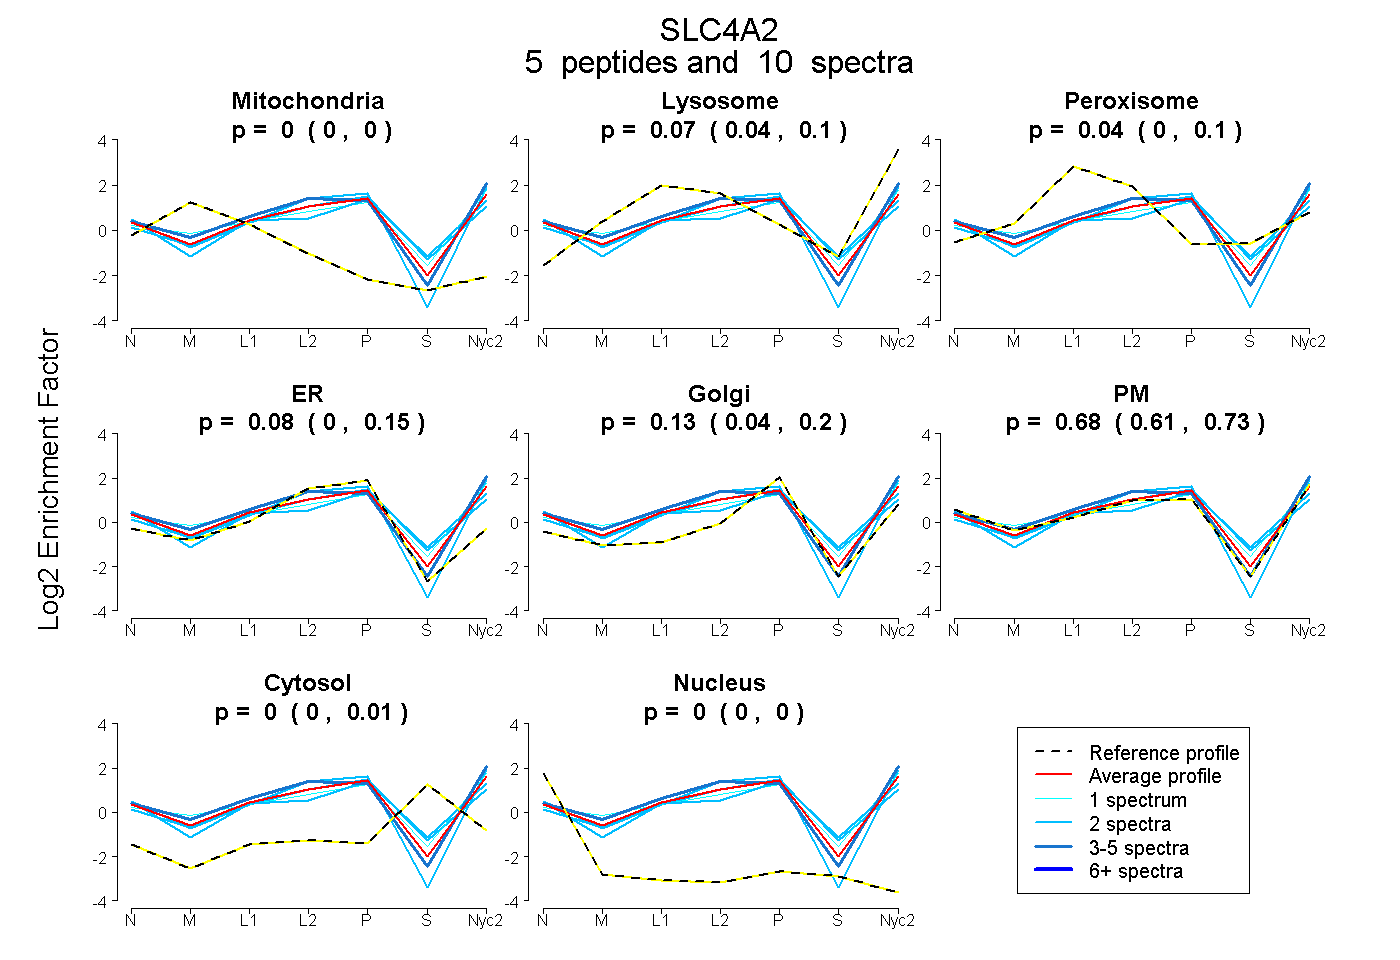
0.000 | 0.000
0.039 | 0.101
0.000 | 0.098
0.000 | 0.146
0.040 | 0.204
0.610 | 0.728
0.000 | 0.009
0.000 | 0.000
6peptides
spectra
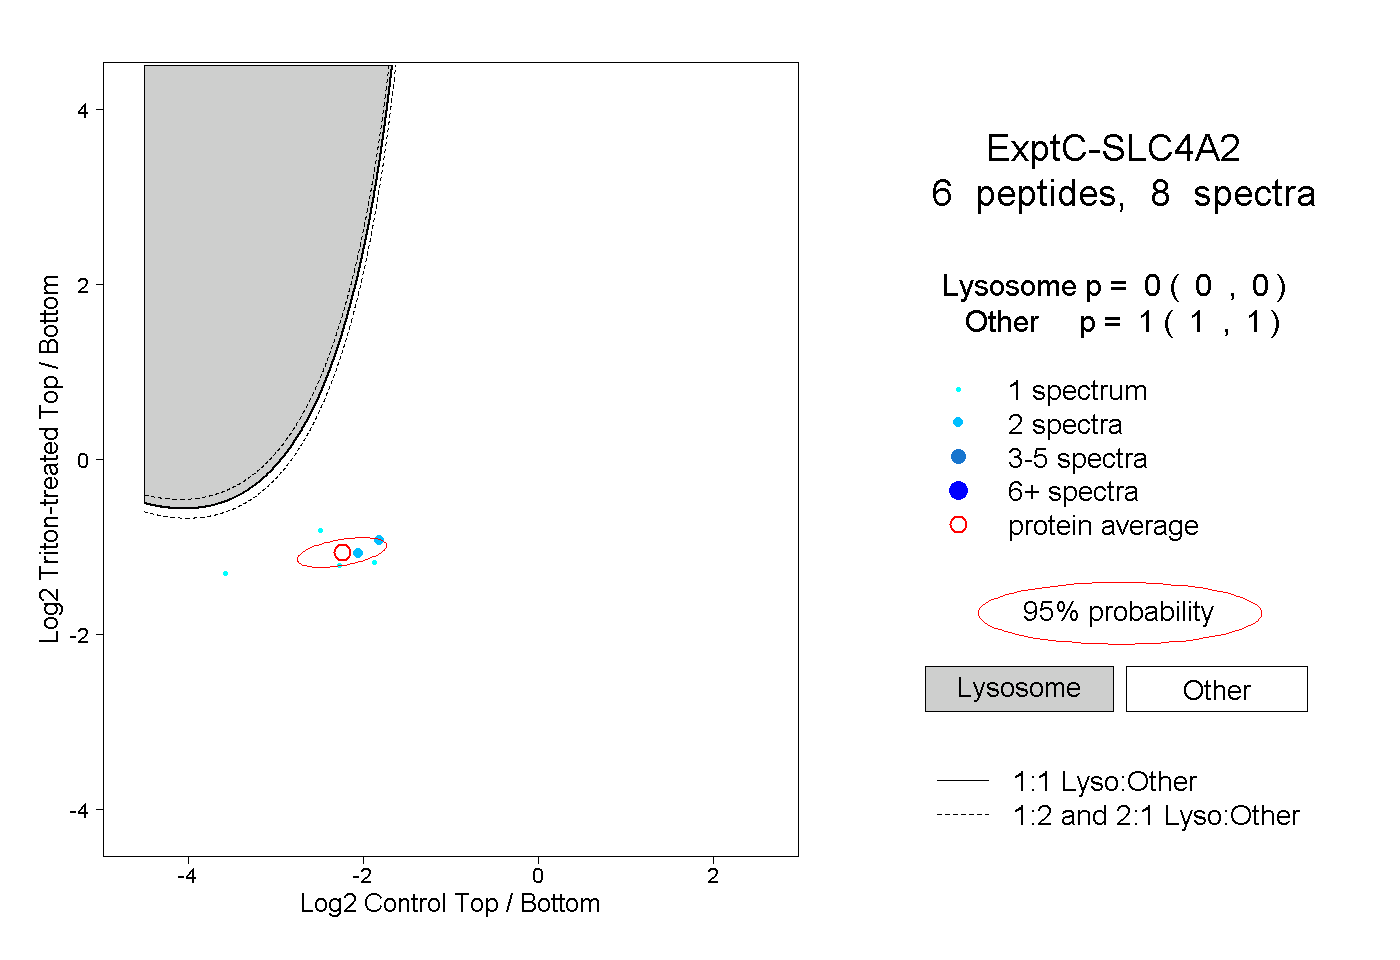
0.000 | 0.000
1.000 | 1.000
1peptide
spectra

NA | NA
NA | NA