 17
17peptides
spectra
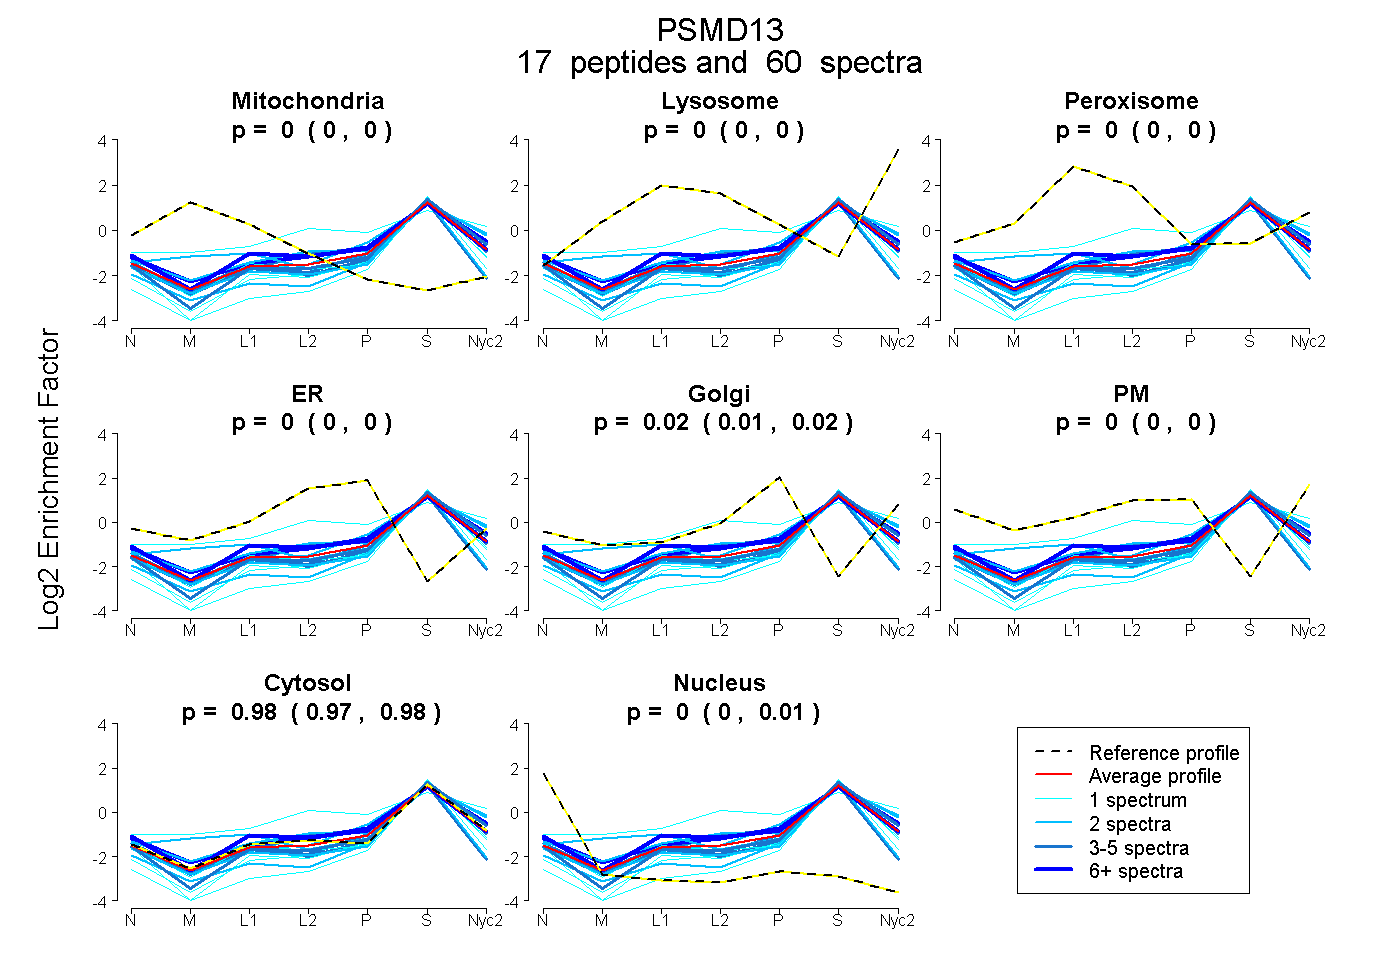
0.000 | 0.000
0.000 | 0.000
0.000 | 0.000
0.000 | 0.000
0.015 | 0.022
0.000 | 0.000
0.974 | 0.980
0.000 | 0.007
4peptides
spectra
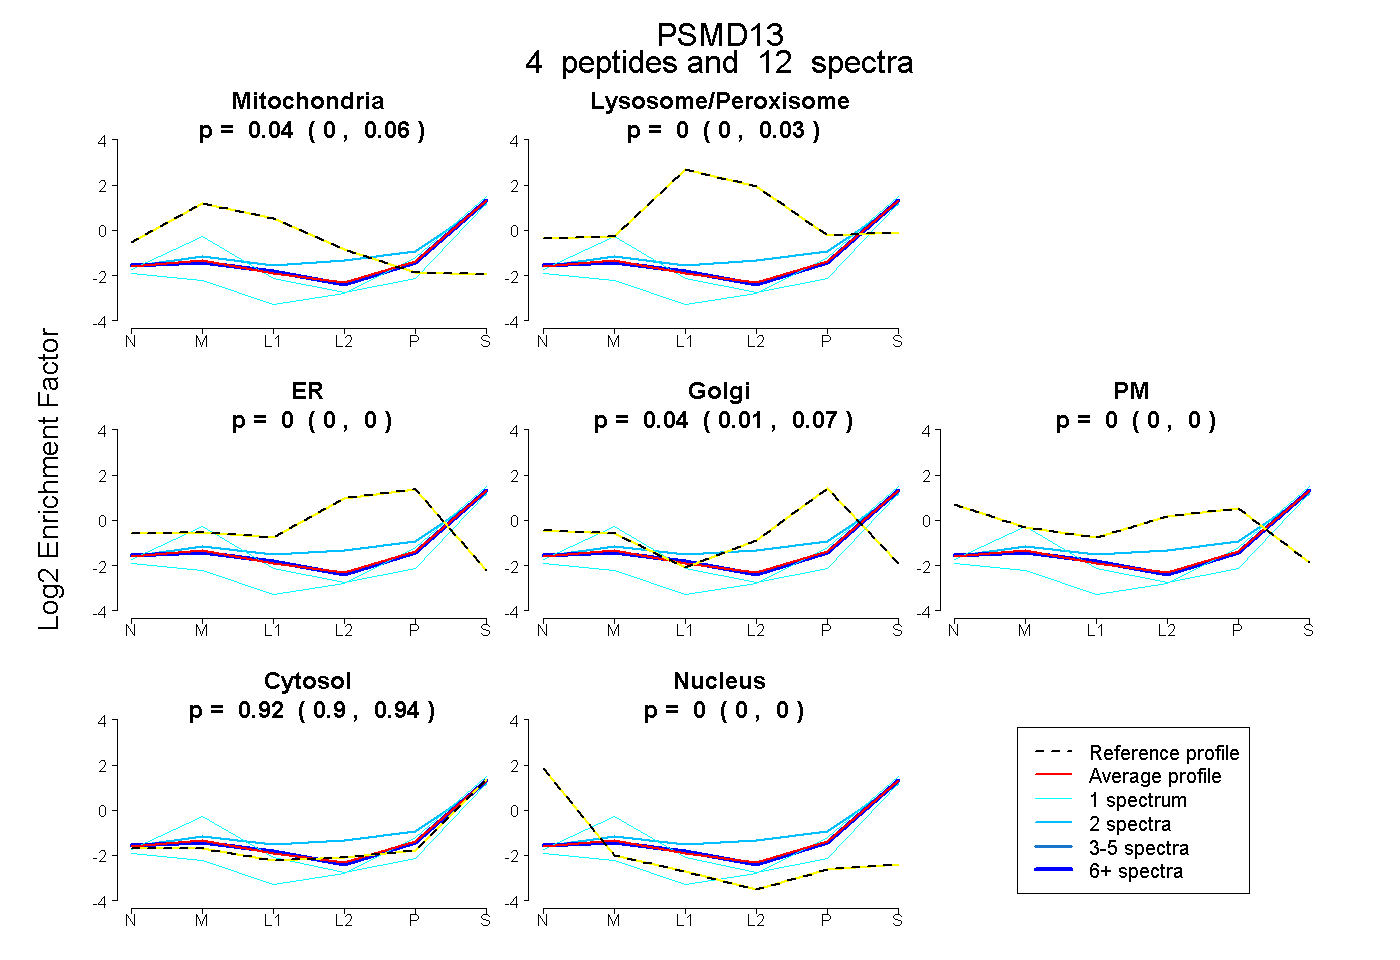
0.000 | 0.061
0.000 | 0.027
0.000 | 0.000
0.010 | 0.066
0.000 | 0.000
0.900 | 0.937
0.000 | 0.000
10peptides
spectra
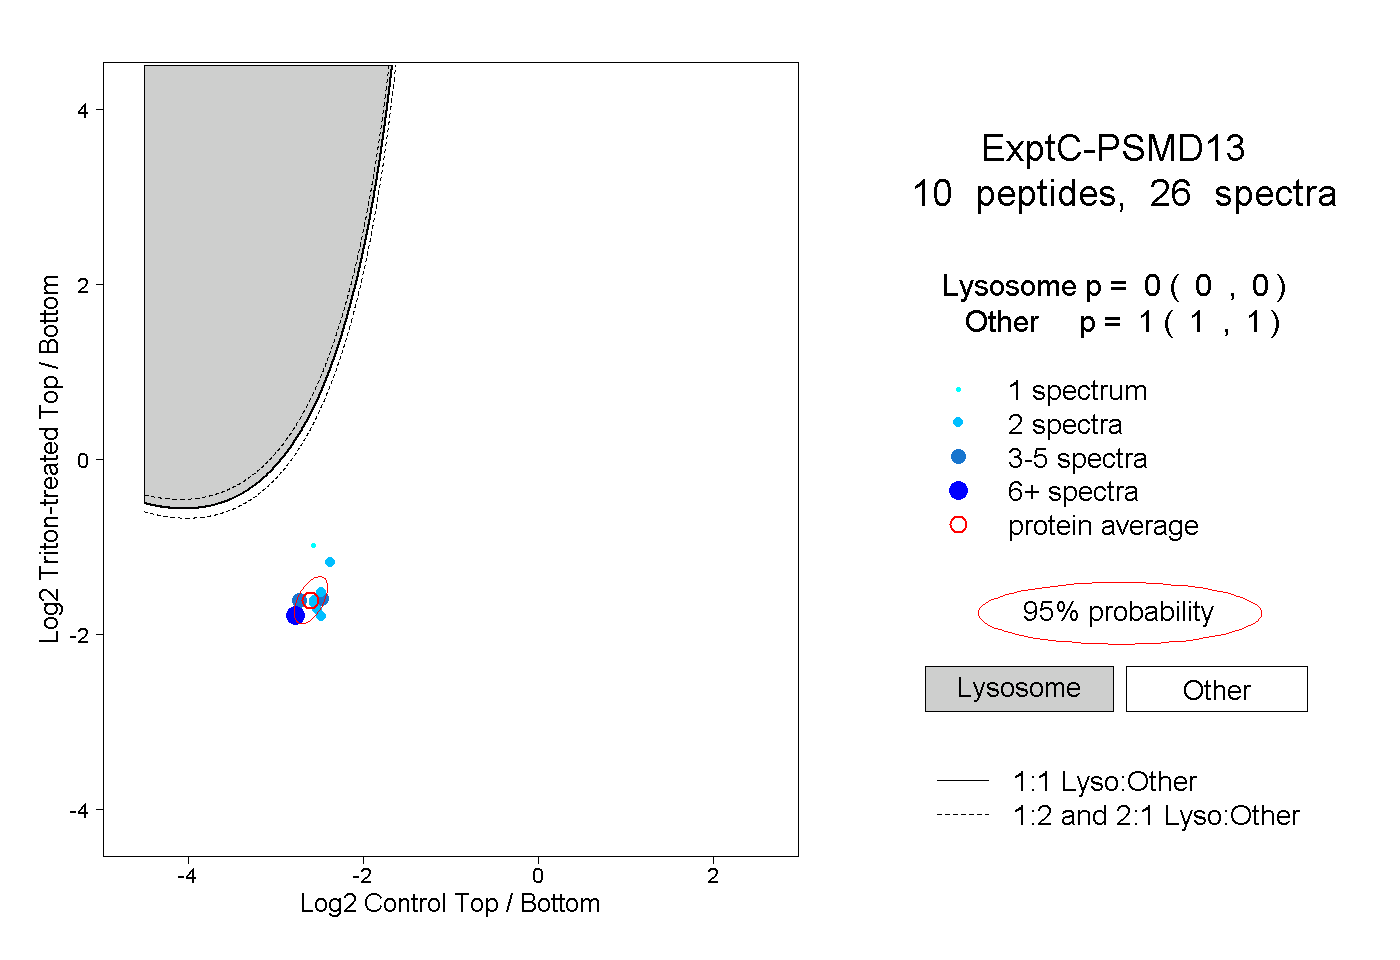
0.000 | 0.000
1.000 | 1.000
2peptides
spectra
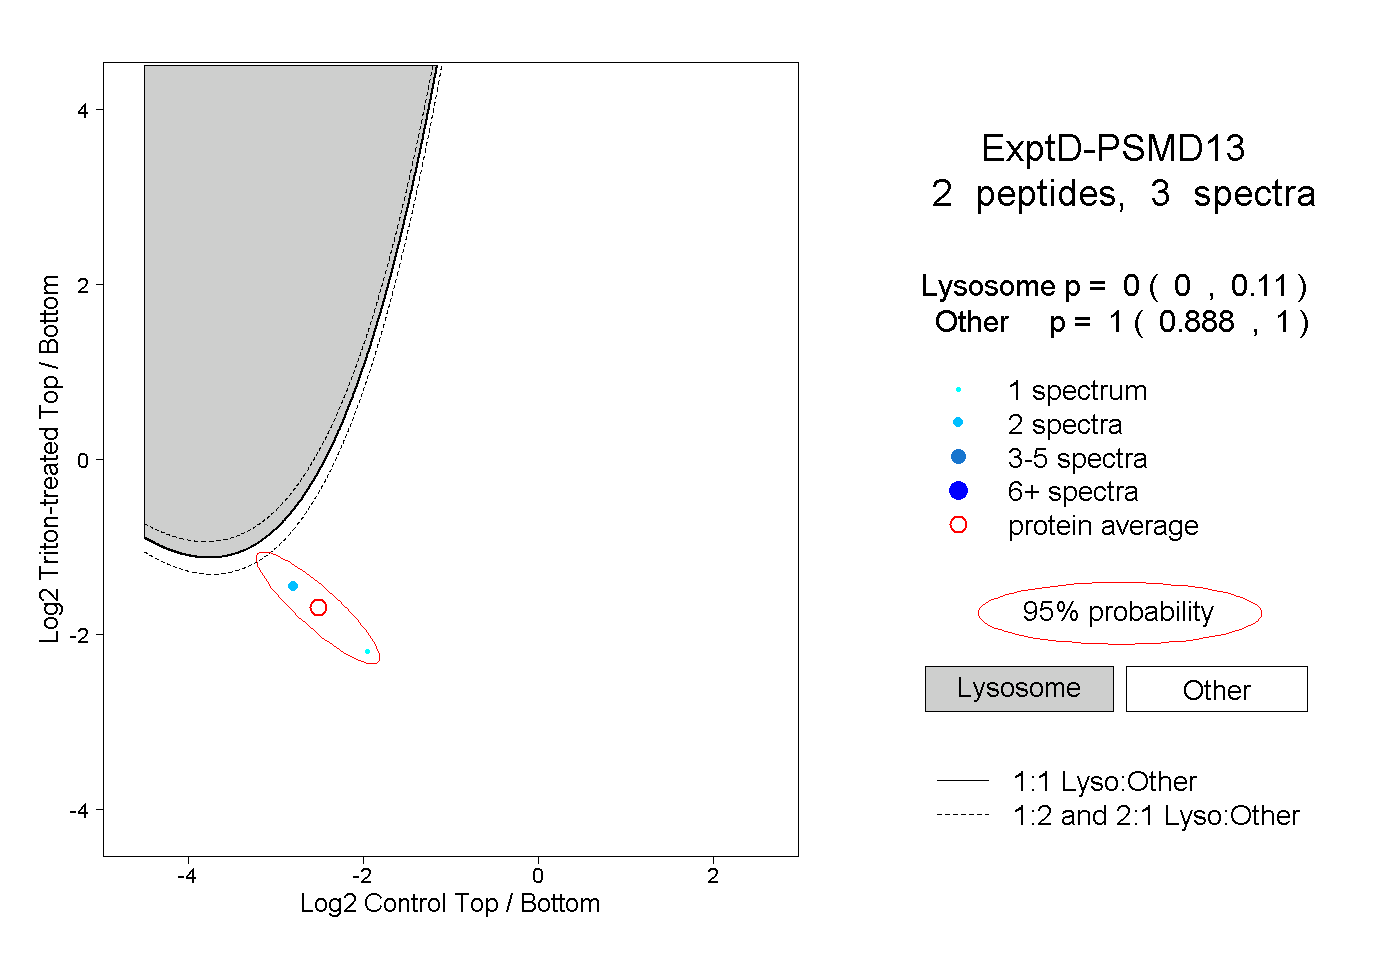
0.000 | 0.110
0.888 | 1.000