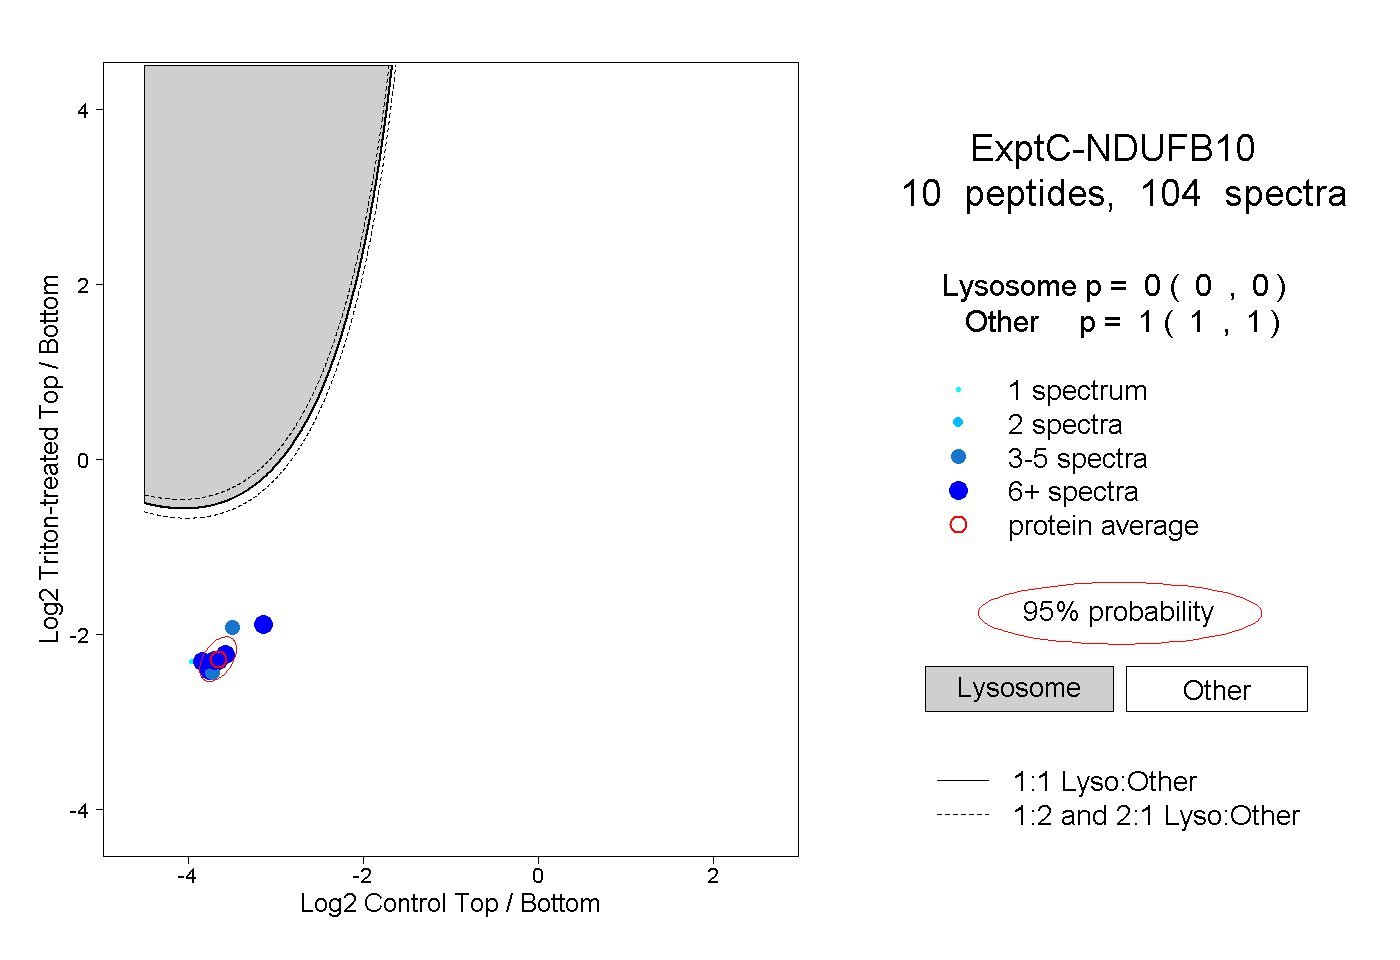
10
10peptides
spectra

0.745 | 0.767
0.000 | 0.000
0.000 | 0.000
0.032 | 0.100
0.000 | 0.000
0.128 | 0.211
0.000 | 0.000
0.000 | 0.000
8peptides
spectra
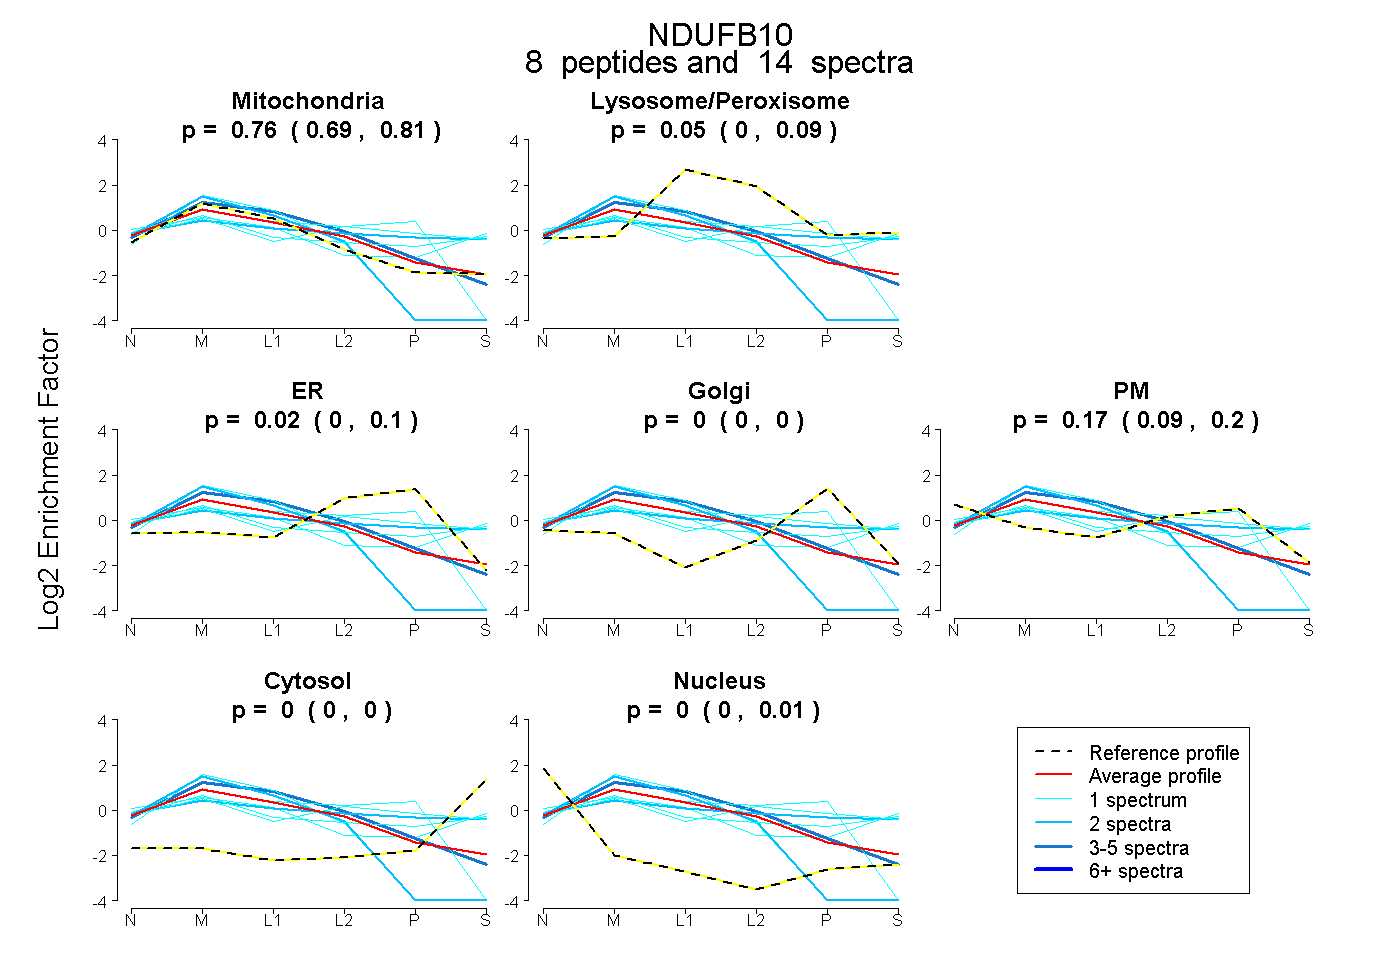
0.692 | 0.812
0.004 | 0.088
0.000 | 0.104
0.000 | 0.000
0.094 | 0.203
0.000 | 0.004
0.000 | 0.007
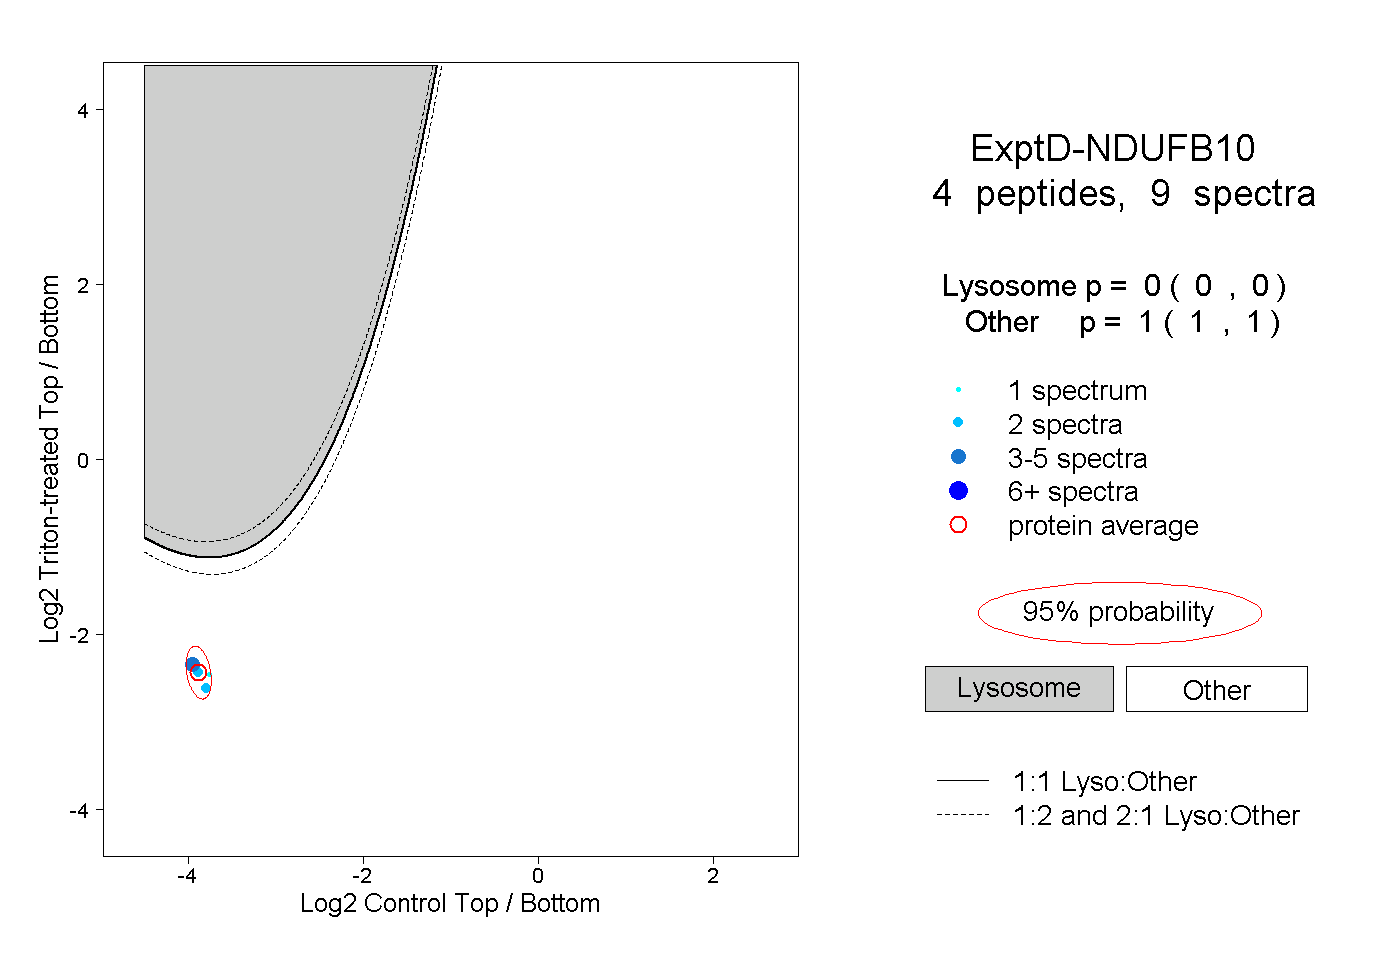
10peptides
spectra
0.000 | 0.000
1.000 | 1.000