 10
10peptides
spectra

0.745 | 0.767
0.000 | 0.000
0.000 | 0.000
0.032 | 0.100
0.000 | 0.000
0.128 | 0.211
0.000 | 0.000
0.000 | 0.000
| Plot | Mito | Lyso | Perox | ER | Golgi | PM | Cytosol | Nucleus | |||||
| Expt A |
10 peptides |
31 spectra |
|
0.757 0.745 | 0.767 |
0.000 0.000 | 0.000 |
0.000 0.000 | 0.000 |
0.070 0.032 | 0.100 |
0.000 0.000 | 0.000 |
0.173 0.128 | 0.211 |
0.000 0.000 | 0.000 |
0.000 0.000 | 0.000 |
| 4 spectra, TYYYHR | 0.505 | 0.035 | 0.159 | 0.000 | 0.062 | 0.227 | 0.012 | 0.000 | ||
| 1 spectrum, EGDVICIYEAEMQWR | 0.993 | 0.000 | 0.000 | 0.000 | 0.000 | 0.000 | 0.000 | 0.007 | ||
| 1 spectrum, VPDITECK | 0.855 | 0.000 | 0.000 | 0.145 | 0.000 | 0.000 | 0.000 | 0.000 | ||
| 3 spectra, EFIEQQHAK | 0.691 | 0.000 | 0.000 | 0.033 | 0.000 | 0.276 | 0.000 | 0.000 | ||
| 5 spectra, AYDLVVDWPVTLVR | 0.832 | 0.000 | 0.000 | 0.000 | 0.000 | 0.168 | 0.000 | 0.000 | ||
| 5 spectra, EGESALQNCAK | 0.746 | 0.000 | 0.000 | 0.180 | 0.000 | 0.074 | 0.000 | 0.000 | ||
| 1 spectrum, TPAPSPQTSIPNPITYLTK | 0.250 | 0.000 | 0.288 | 0.000 | 0.000 | 0.415 | 0.048 | 0.000 | ||
| 4 spectra, ELEQFTQVSK | 0.760 | 0.000 | 0.000 | 0.000 | 0.000 | 0.240 | 0.000 | 0.000 | ||
| 4 spectra, YQDLGAYYSAR | 0.815 | 0.000 | 0.000 | 0.000 | 0.000 | 0.185 | 0.000 | 0.000 | ||
| 3 spectra, VDQEILNIIQER | 0.809 | 0.052 | 0.000 | 0.000 | 0.000 | 0.139 | 0.000 | 0.000 |
| Plot | Mito | Lyso or Perox | ER | Golgi | PM | Cytosol | Nucleus | ||||||
| Expt B |
8 peptides |
14 spectra |
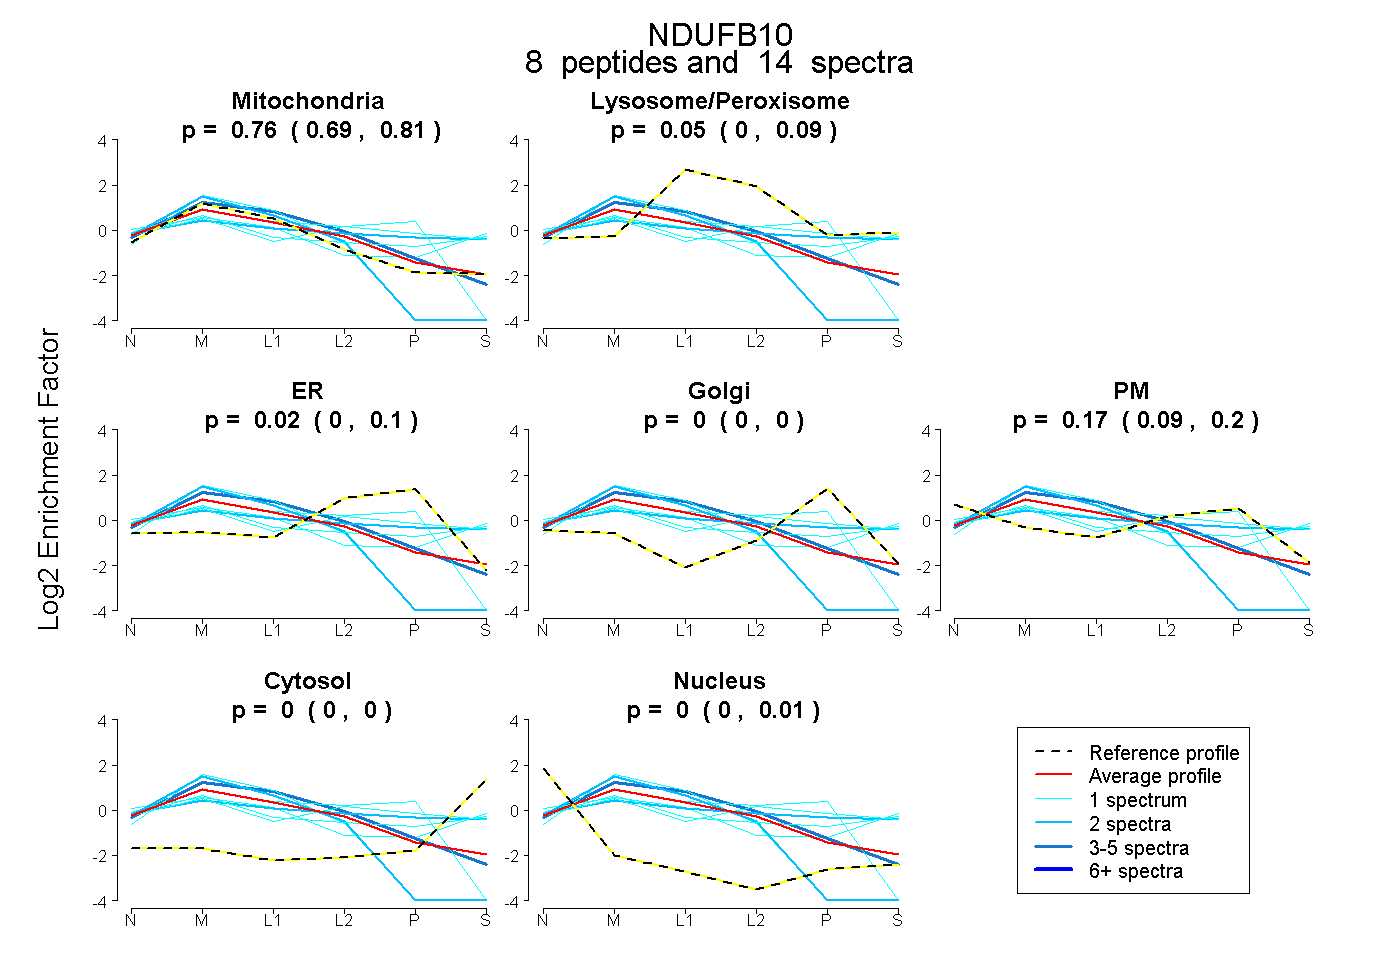 |
0.758 0.692 | 0.812 |
0.050 0.004 | 0.088 |
0.018 0.000 | 0.104 |
0.000 0.000 | 0.000 |
0.174 0.094 | 0.203 |
0.000 0.000 | 0.004 |
0.000 0.000 | 0.007 |
|||
| Plot | Lyso | Other | |||||||||||
| Expt C |
10 peptides |
104 spectra |
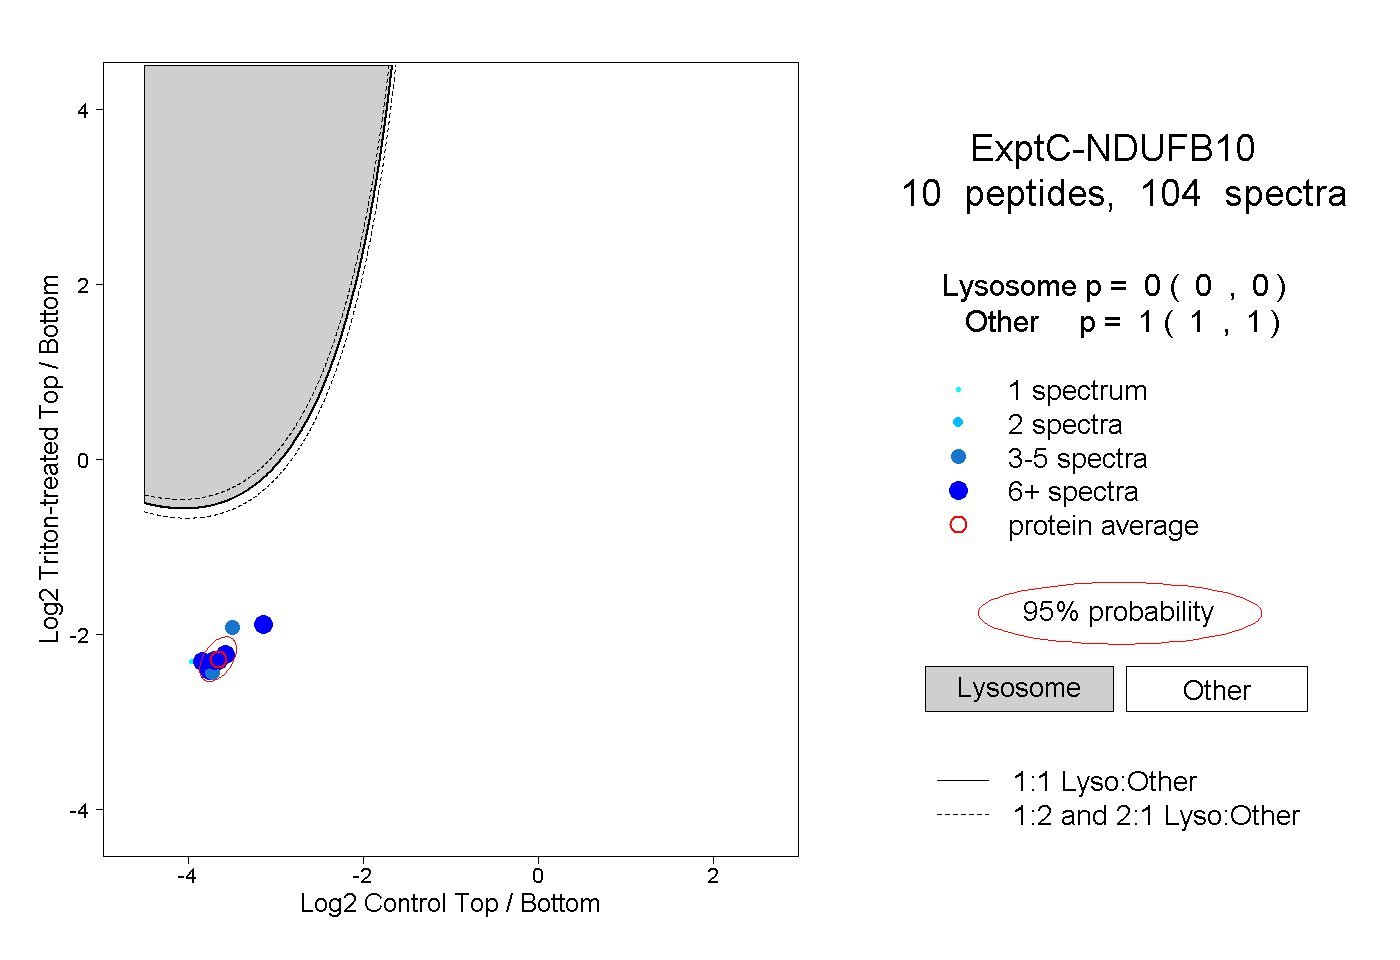 |
0.000 0.000 | 0.000 |
1.000 1.000 | 1.000 |
||||||||
| Plot | Lyso | Other | |||||||||||
| Expt D |
4 peptides |
9 spectra |
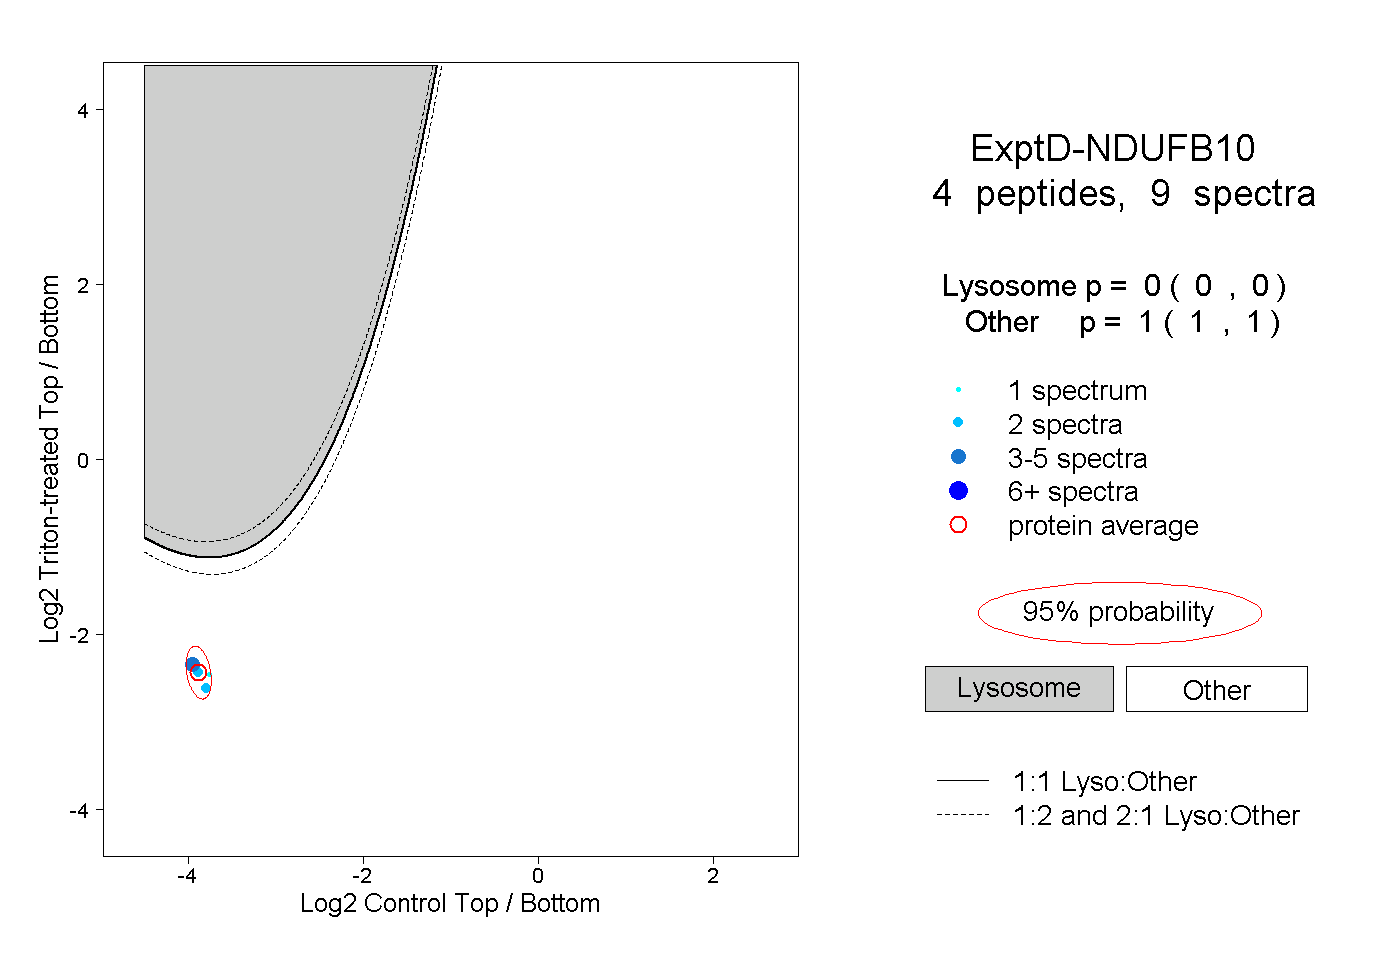 |
0.000 0.000 | 0.000 |
1.000 1.000 | 1.000 |