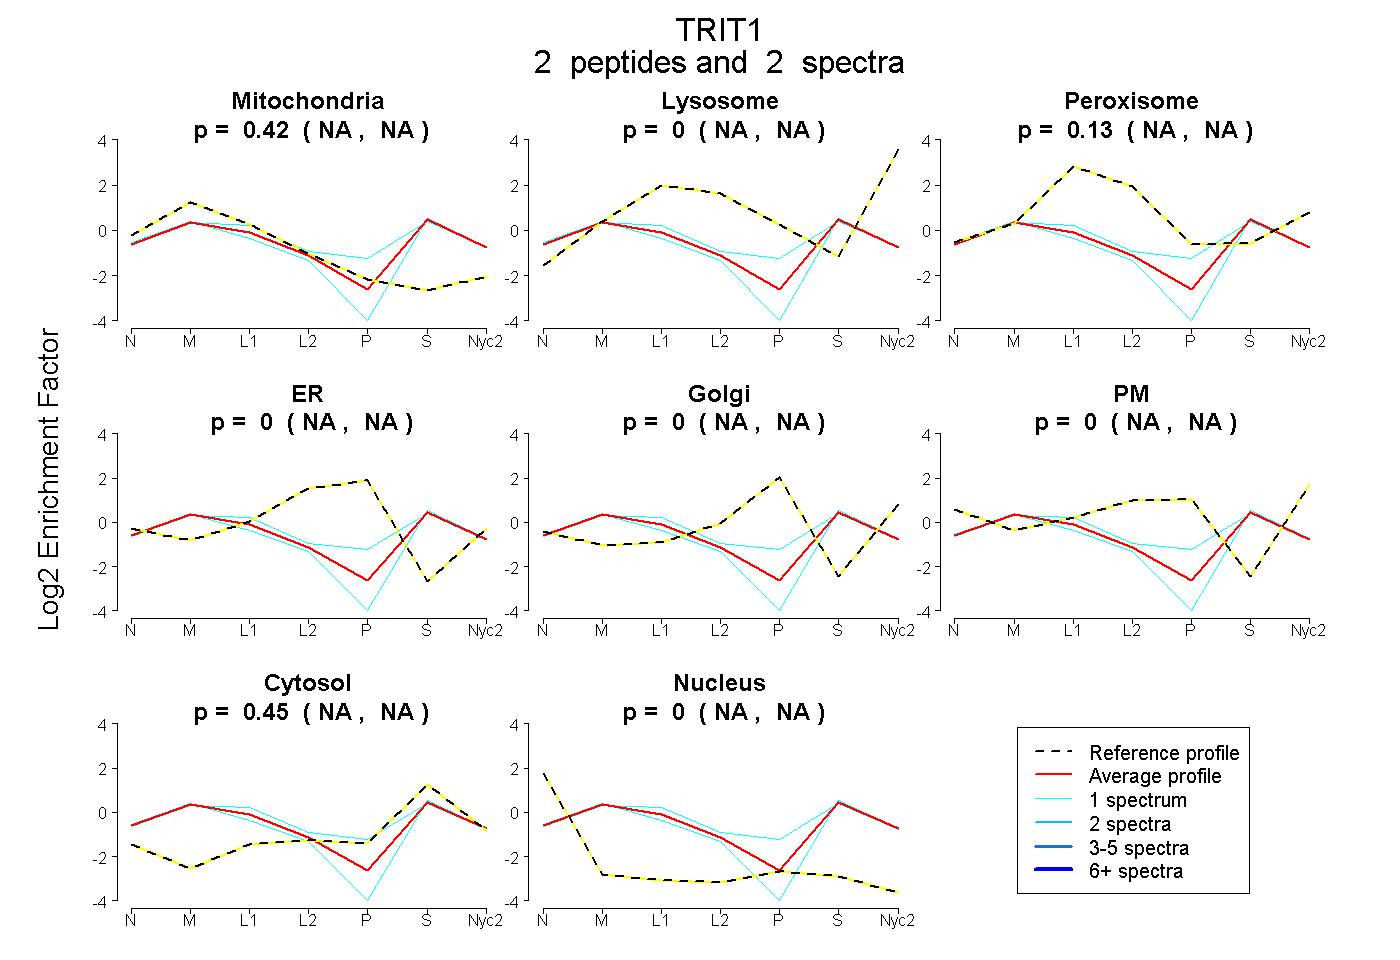
 2
2peptides
spectra
NA | NA
NA | NA
NA | NA
NA | NA
NA | NA
NA | NA
NA | NA
NA | NA
| Plot | Mito | Lyso | Perox | ER | Golgi | PM | Cytosol | Nucleus | |||||
| Expt A |
2 peptides |
2 spectra |
|
0.421 NA | NA |
0.000 NA | NA |
0.126 NA | NA |
0.000 NA | NA |
0.000 NA | NA |
0.000 NA | NA |
0.453 NA | NA |
0.000 NA | NA |
| 1 spectrum, TLPLVVILGATGTGK | 0.515 | 0.000 | 0.006 | 0.000 | 0.000 | 0.000 | 0.479 | 0.000 | ||
| 1 spectrum, AVPVSSGFR | 0.327 | 0.000 | 0.247 | 0.000 | 0.000 | 0.000 | 0.427 | 0.000 |
| Plot | Lyso | Other | |||||||||||
| Expt C |
2 peptides |
5 spectra |
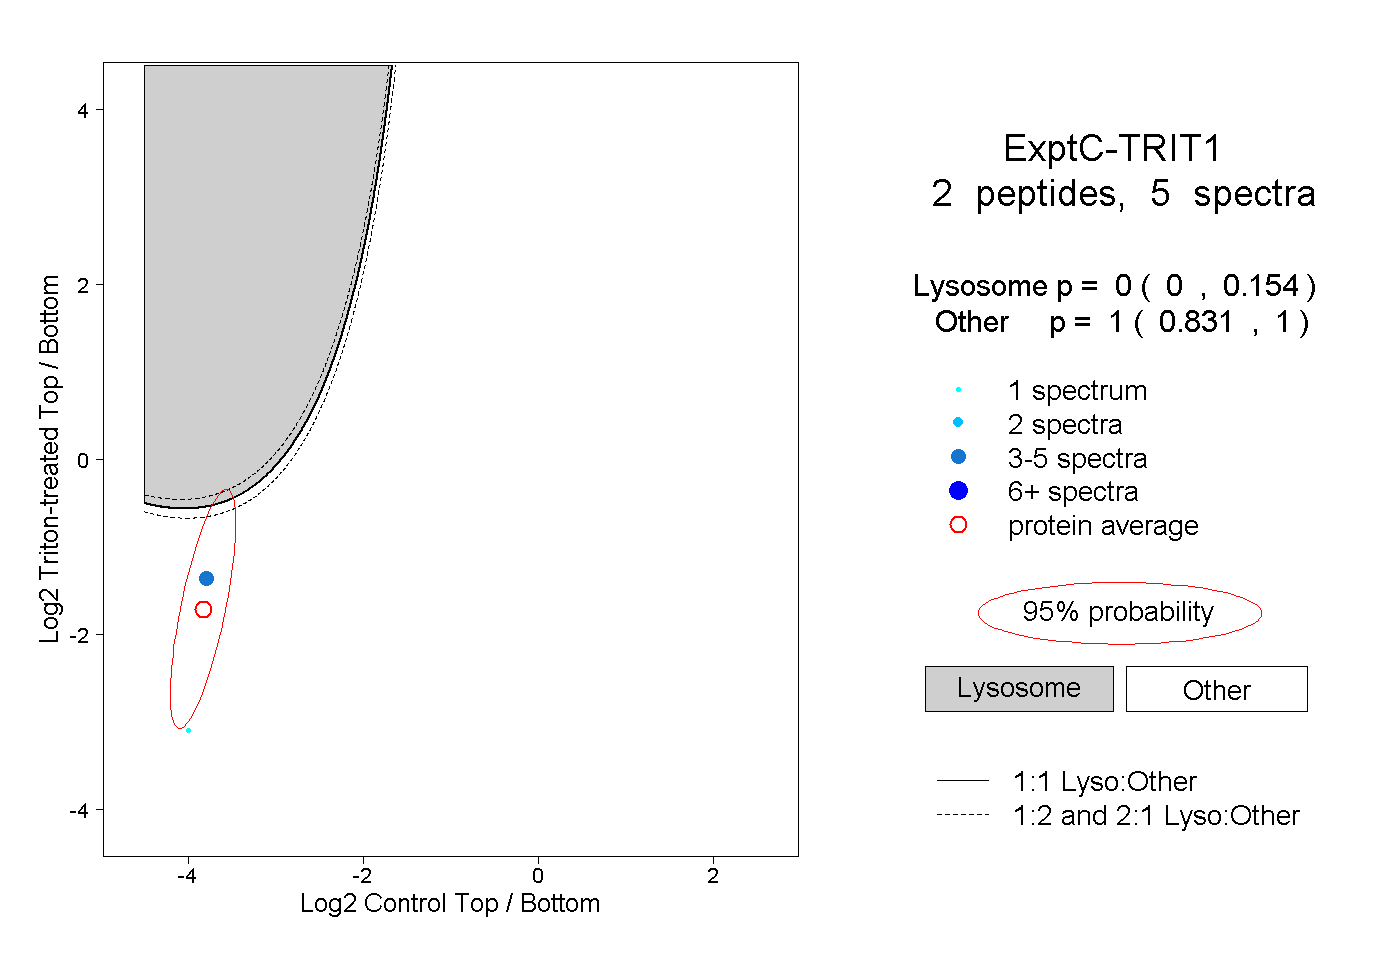 |
0.000 0.000 | 0.154 |
1.000 0.831 | 1.000 |