 5
5peptides
spectra
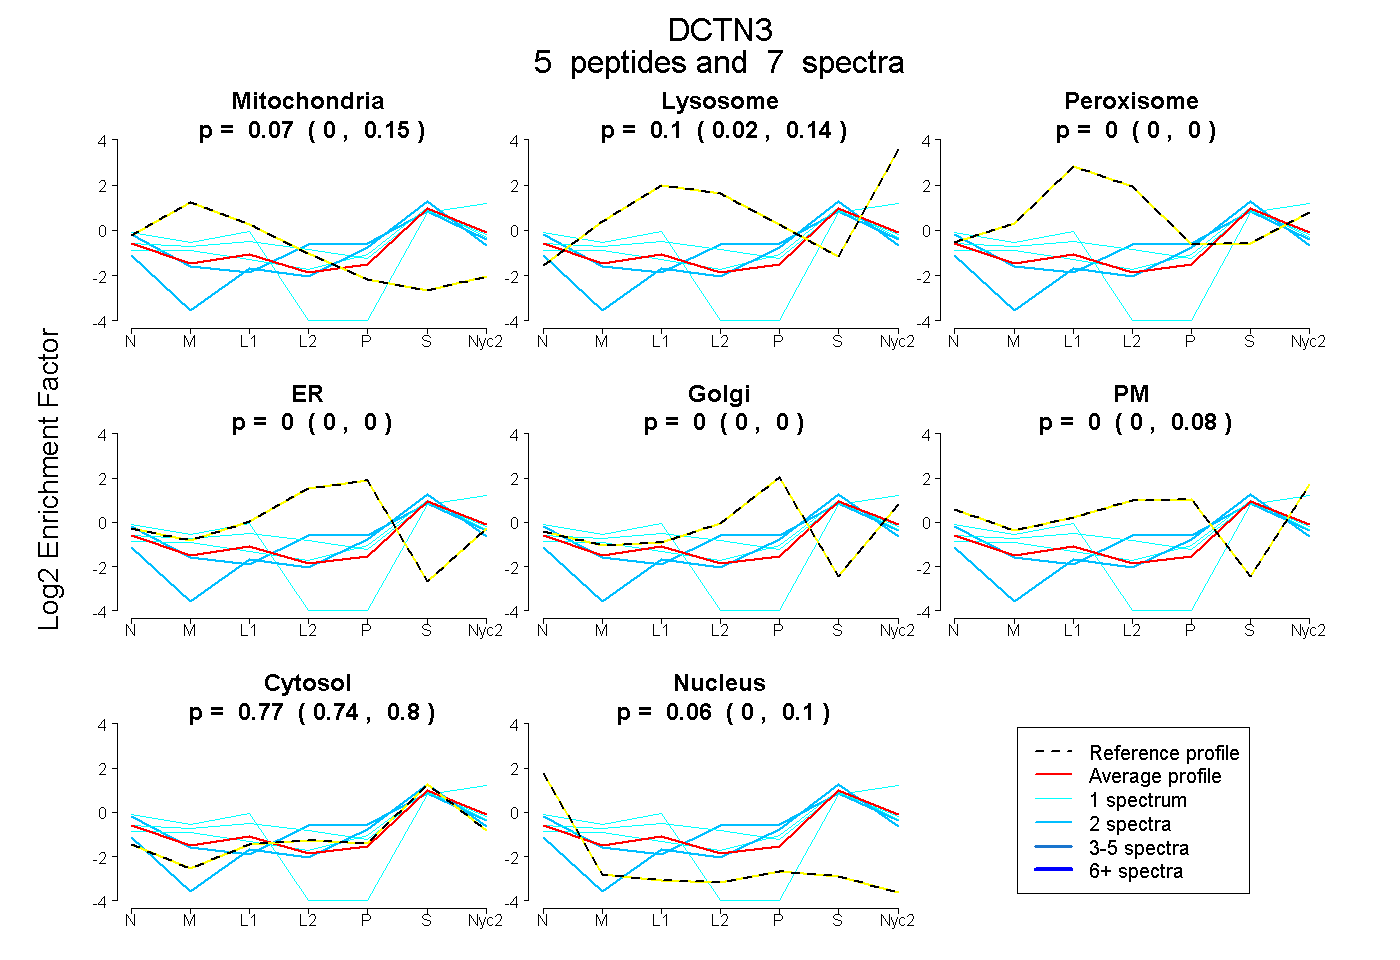
0.000 | 0.153
0.020 | 0.139
0.000 | 0.000
0.000 | 0.000
0.000 | 0.000
0.000 | 0.080
0.738 | 0.799
0.000 | 0.099
2peptides
spectra
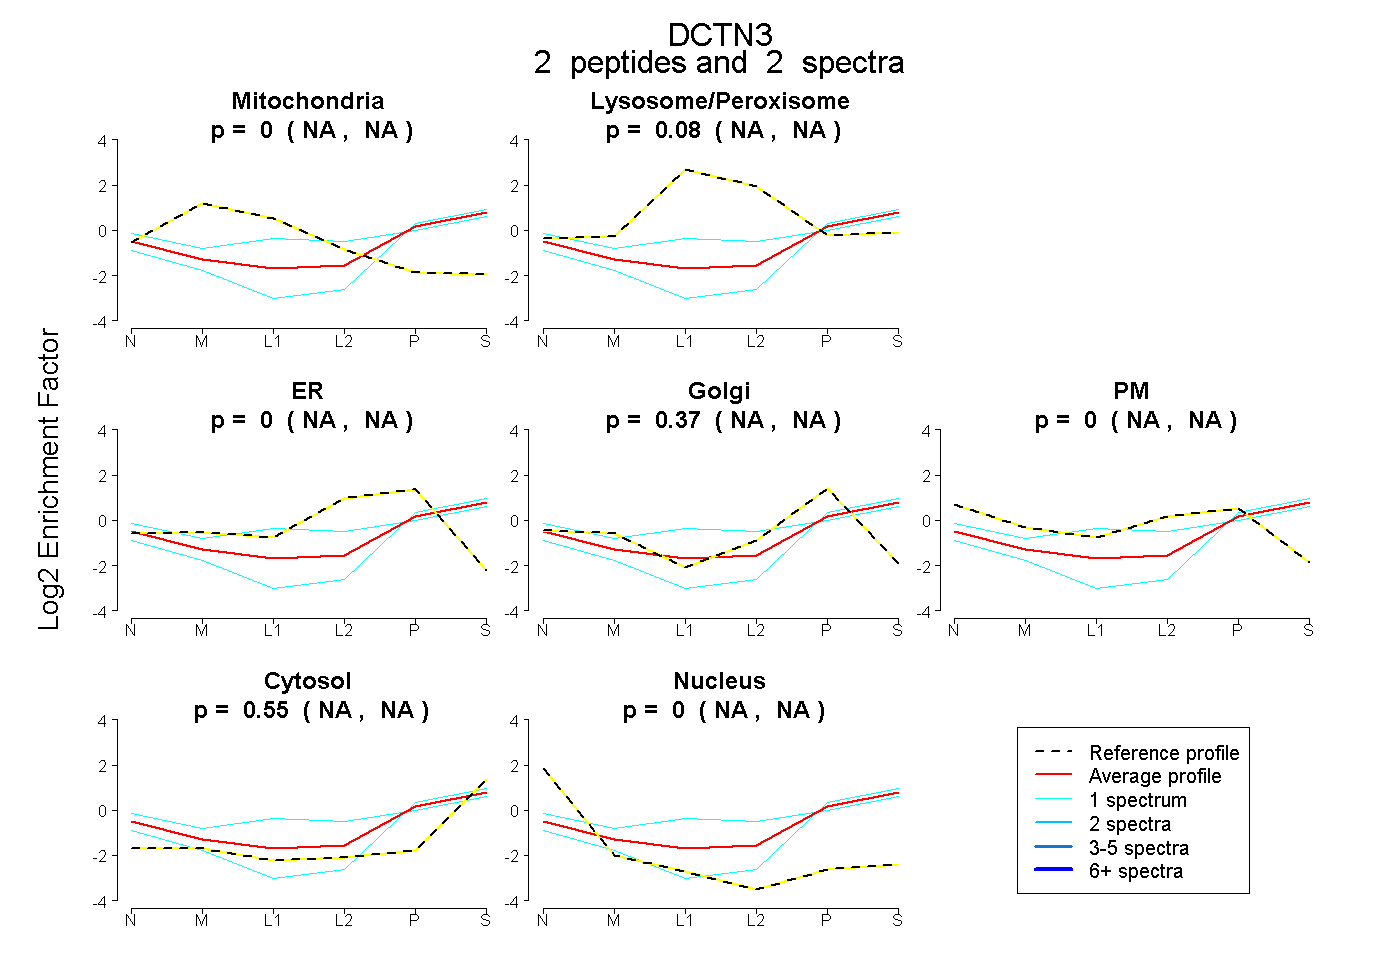
NA | NA
NA | NA
NA | NA
NA | NA
NA | NA
NA | NA
NA | NA
| Plot | Mito | Lyso | Perox | ER | Golgi | PM | Cytosol | Nucleus | |||||
| Expt A |
5 peptides |
7 spectra |
|
0.074 0.000 | 0.153 |
0.101 0.020 | 0.139 |
0.000 0.000 | 0.000 |
0.000 0.000 | 0.000 |
0.000 0.000 | 0.000 |
0.000 0.000 | 0.080 |
0.770 0.738 | 0.799 |
0.055 0.000 | 0.099 |
||
| Plot | Mito | Lyso or Perox | ER | Golgi | PM | Cytosol | Nucleus | ||||||
| Expt B |
2 peptides |
2 spectra |
|
0.000 NA | NA |
0.082 NA | NA |
0.000 NA | NA |
0.366 NA | NA |
0.001 NA | NA |
0.551 NA | NA |
0.000 NA | NA |
| 1 spectrum, YLDPEYIDR | 0.000 | 0.000 | 0.000 | 0.327 | 0.000 | 0.673 | 0.000 | |||
| 1 spectrum, VQVALGNIASK | 0.000 | 0.300 | 0.000 | 0.075 | 0.229 | 0.396 | 0.000 |
| Plot | Lyso | Other | |||||||||||
| Expt C |
7 peptides |
11 spectra |
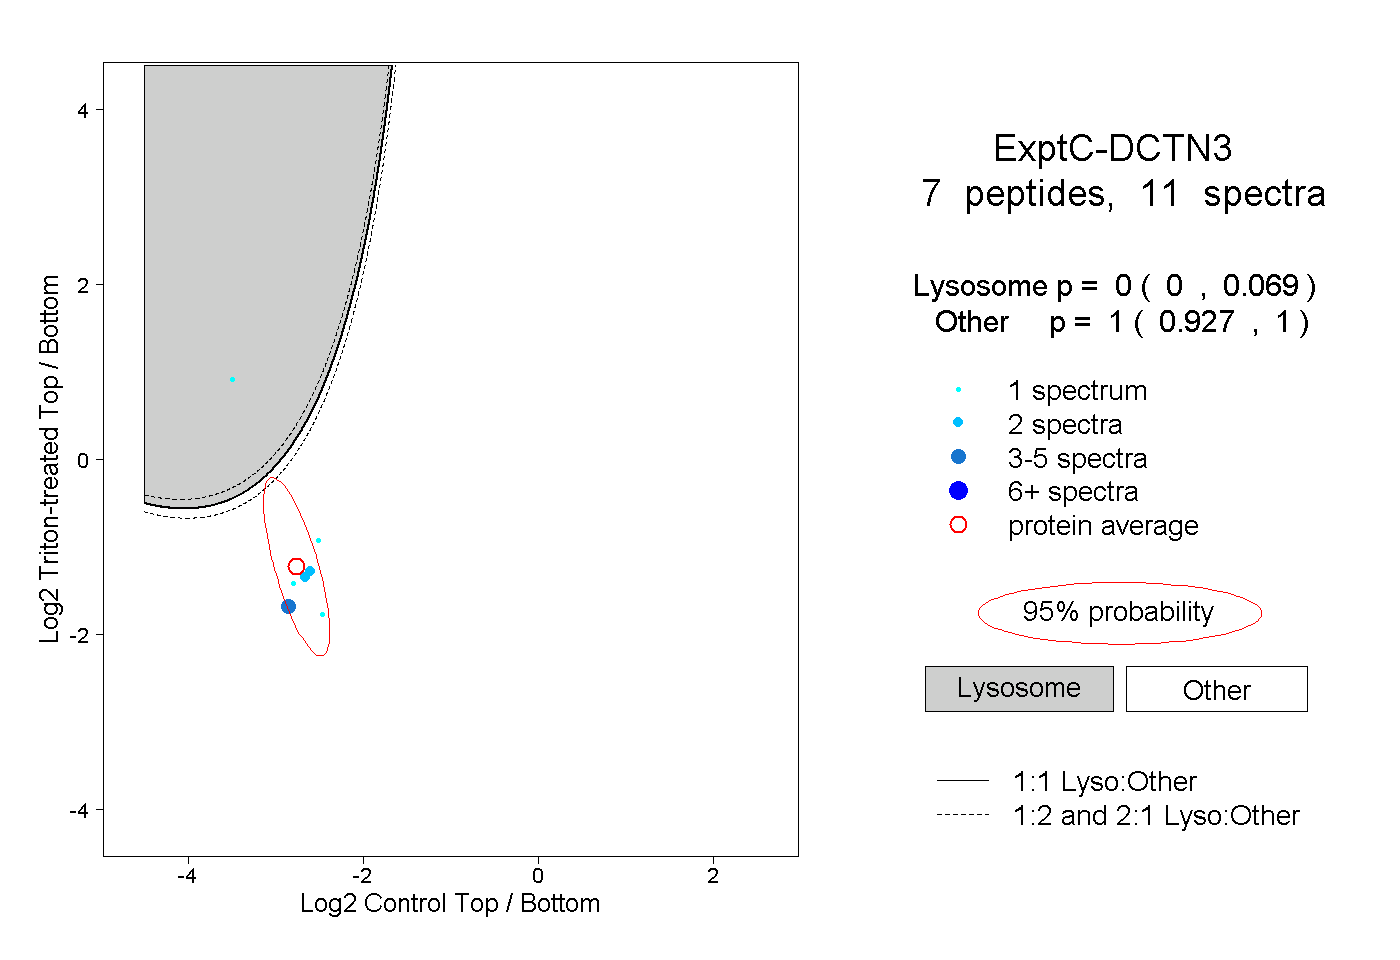 |
0.000 0.000 | 0.069 |
1.000 0.927 | 1.000 |