 32
32peptides
spectra
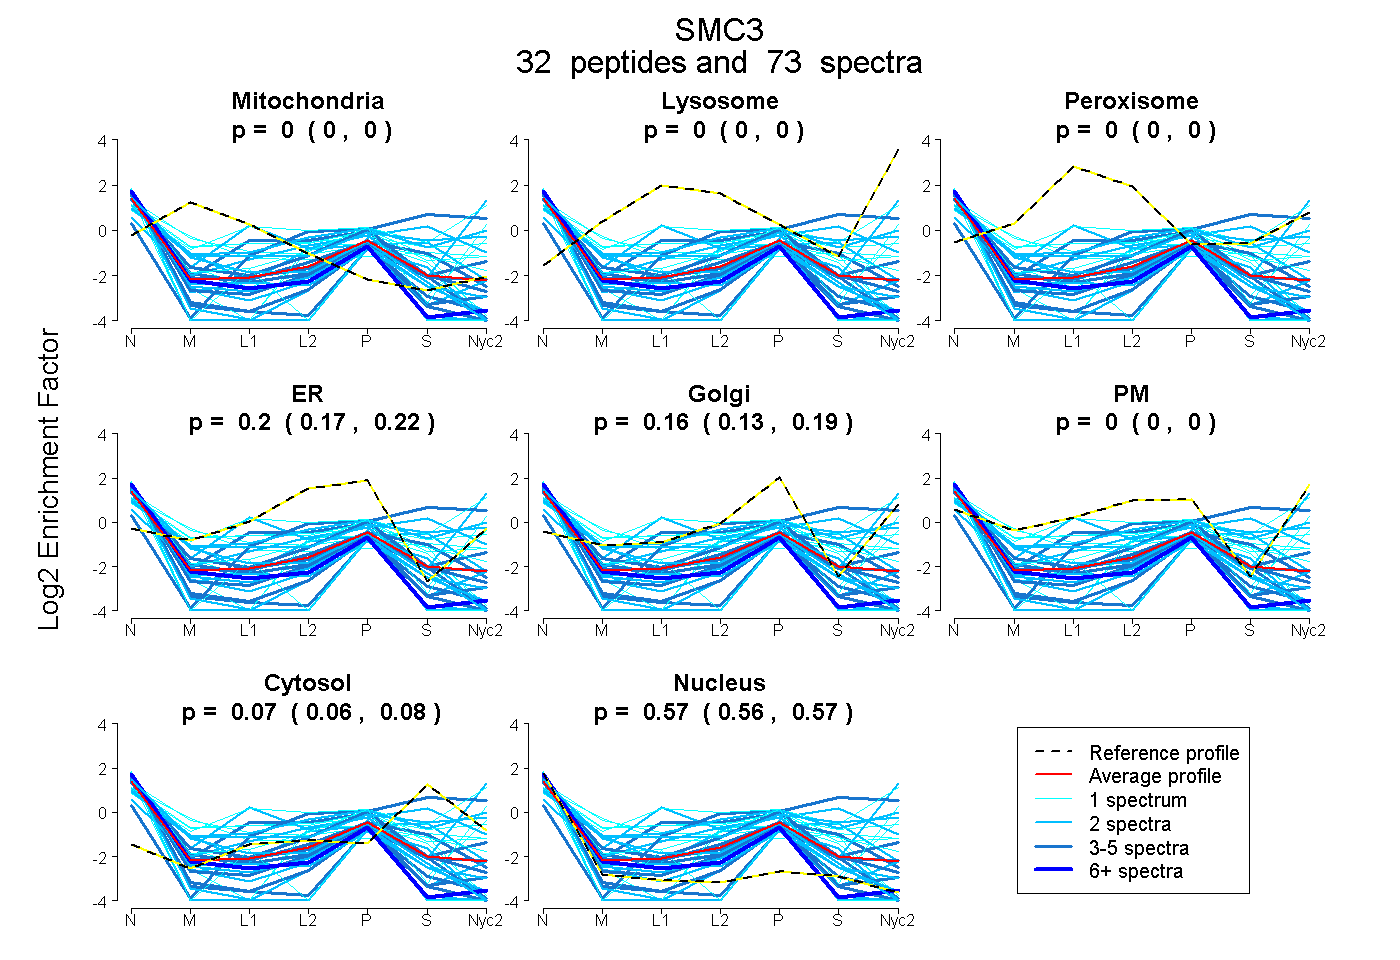
0.000 | 0.000
0.000 | 0.000
0.000 | 0.000
0.173 | 0.221
0.133 | 0.186
0.000 | 0.000
0.063 | 0.080
0.559 | 0.573
3peptides
spectra
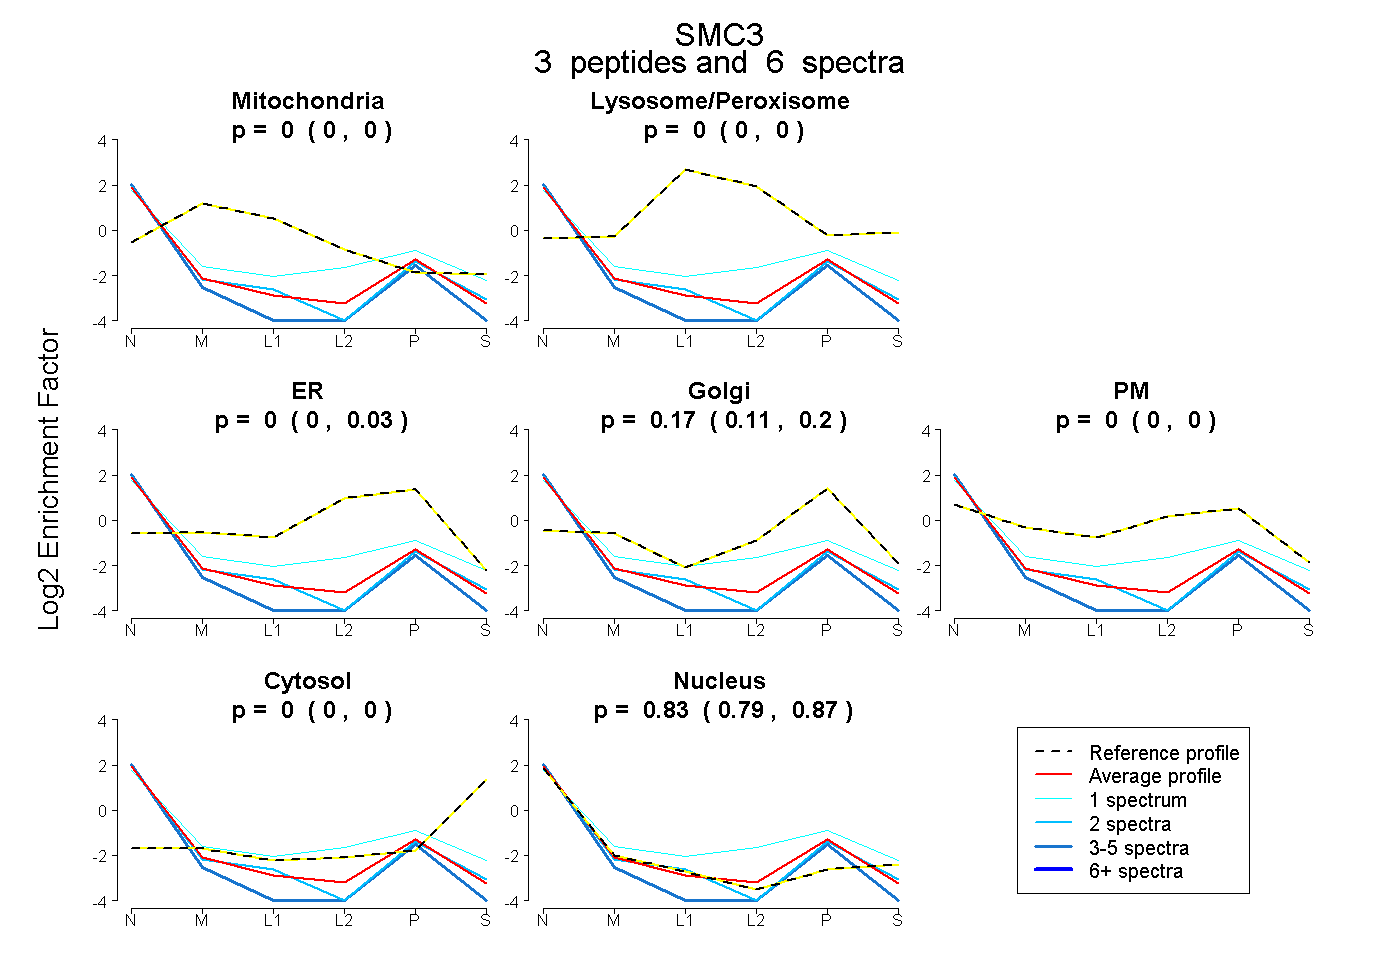
0.000 | 0.000
0.000 | 0.000
0.000 | 0.030
0.112 | 0.199
0.000 | 0.000
0.000 | 0.000
0.793 | 0.866
7peptides
spectra
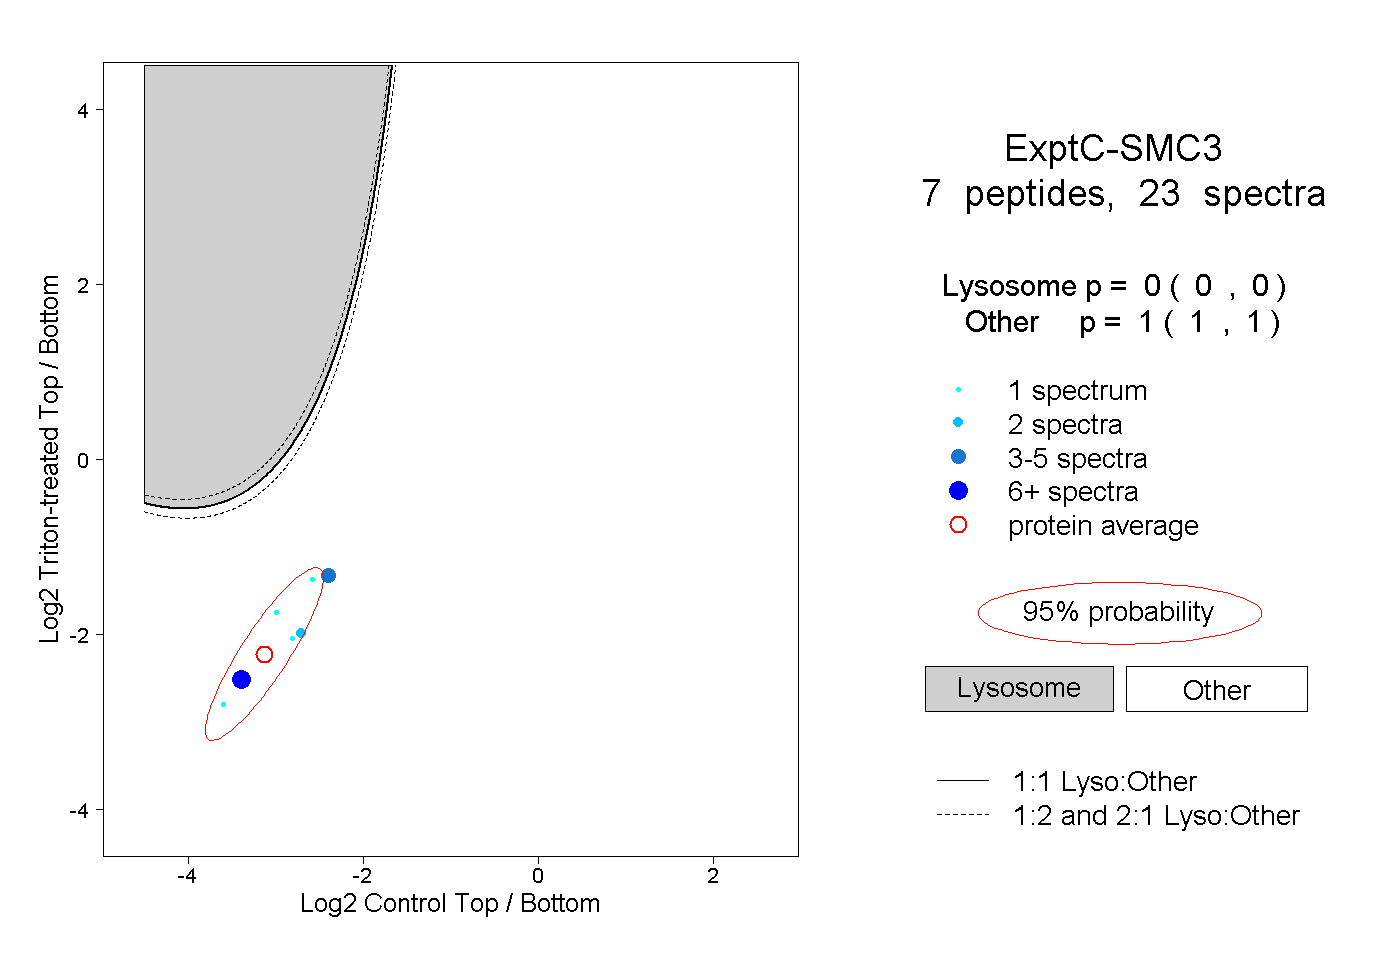
0.000 | 0.000
1.000 | 1.000
1peptide
spectrum
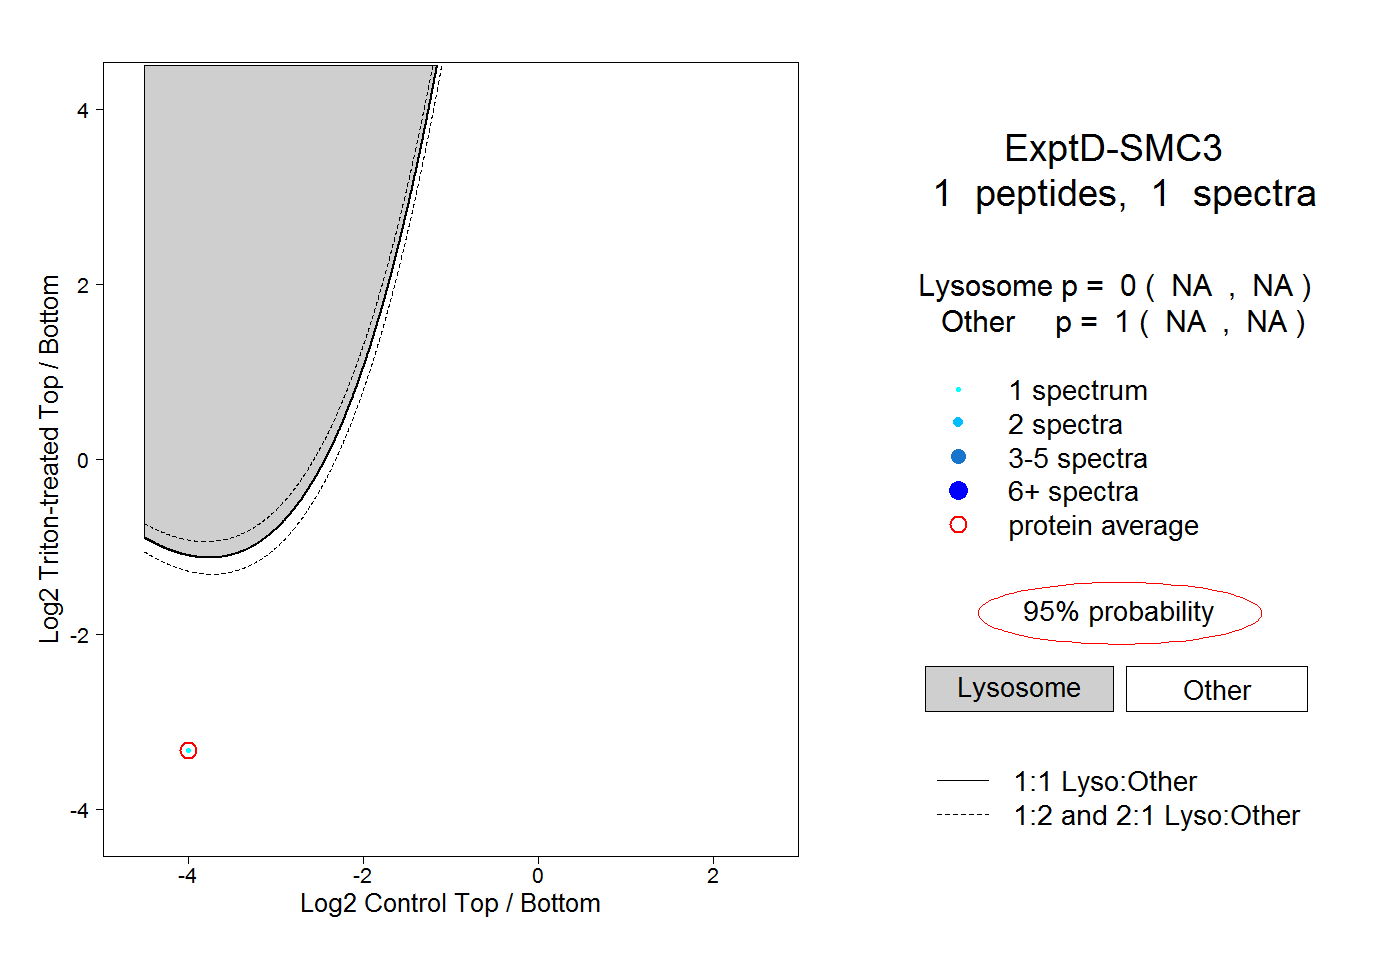
NA | NA
NA | NA