 6
6peptides
spectra
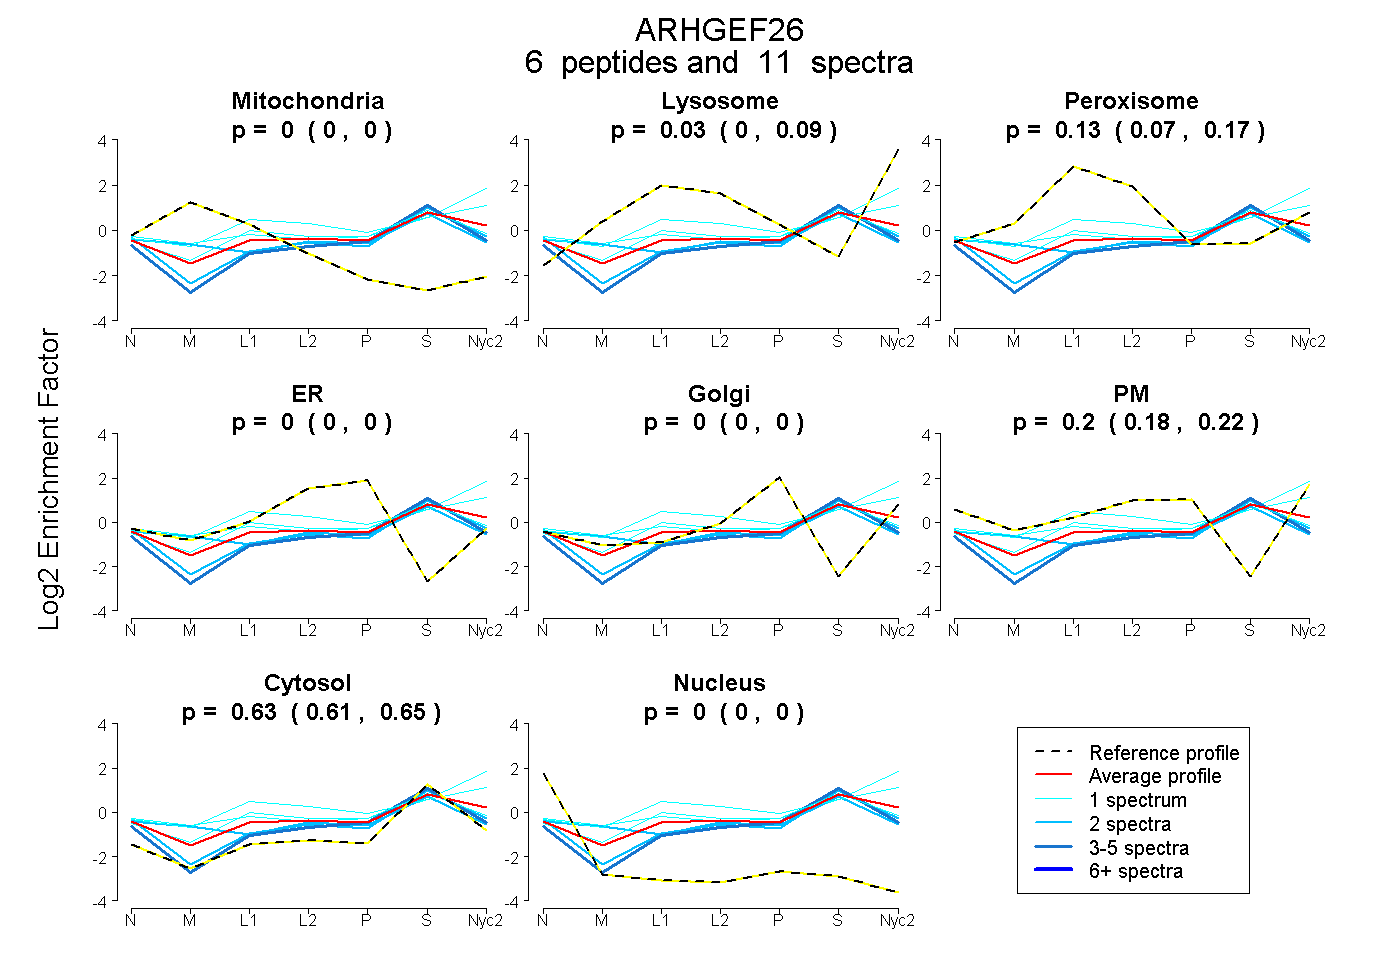
0.000 | 0.000
0.000 | 0.086
0.071 | 0.172
0.000 | 0.000
0.000 | 0.000
0.179 | 0.220
0.613 | 0.654
0.000 | 0.000
1peptide
spectrum
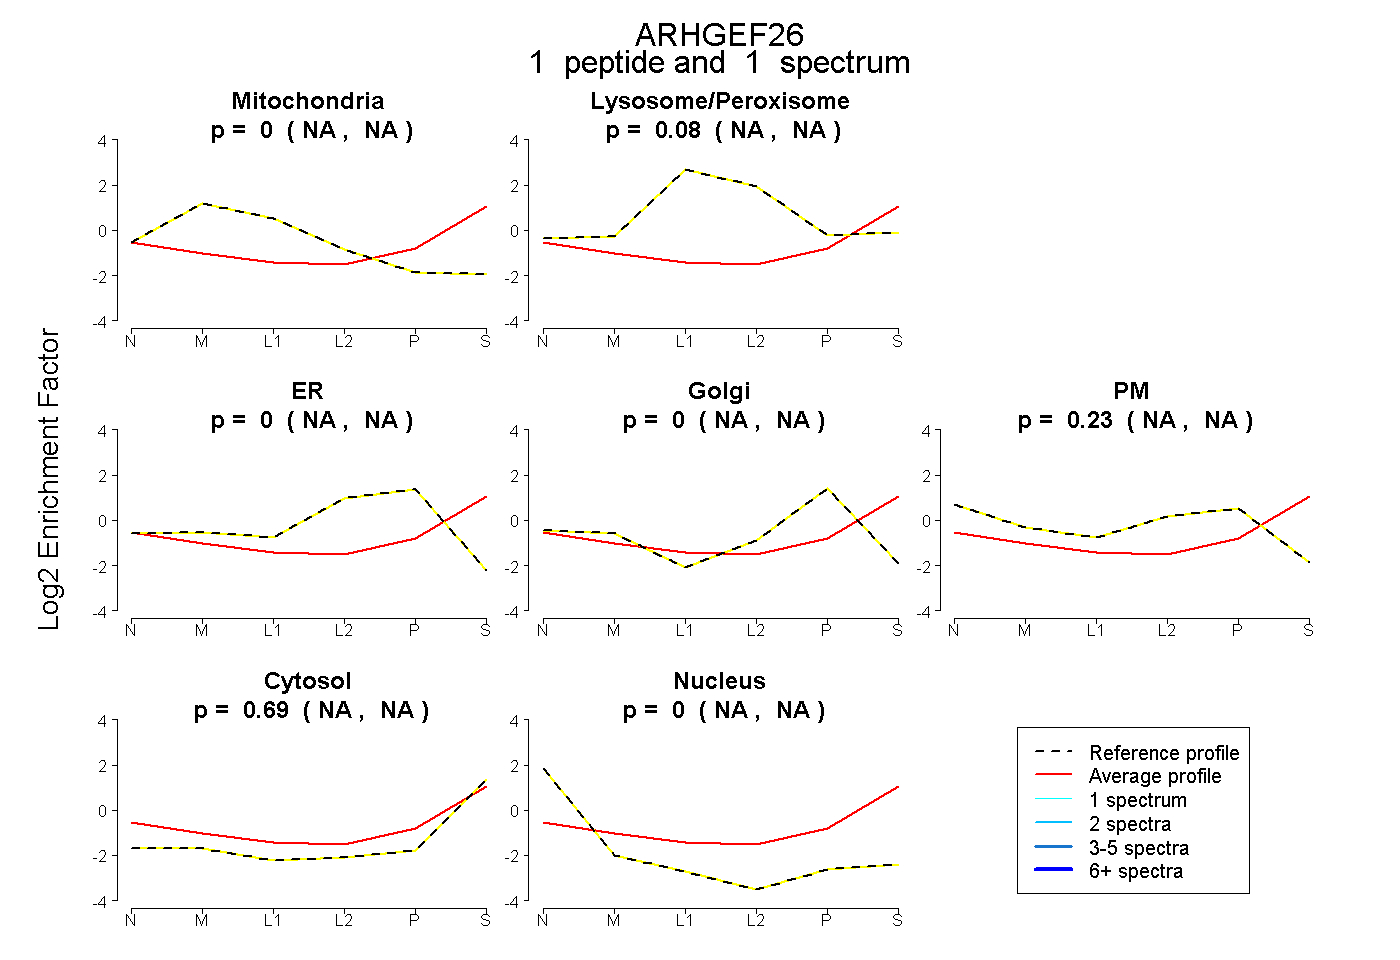
NA | NA
NA | NA
NA | NA
NA | NA
NA | NA
NA | NA
NA | NA
6peptides
spectra
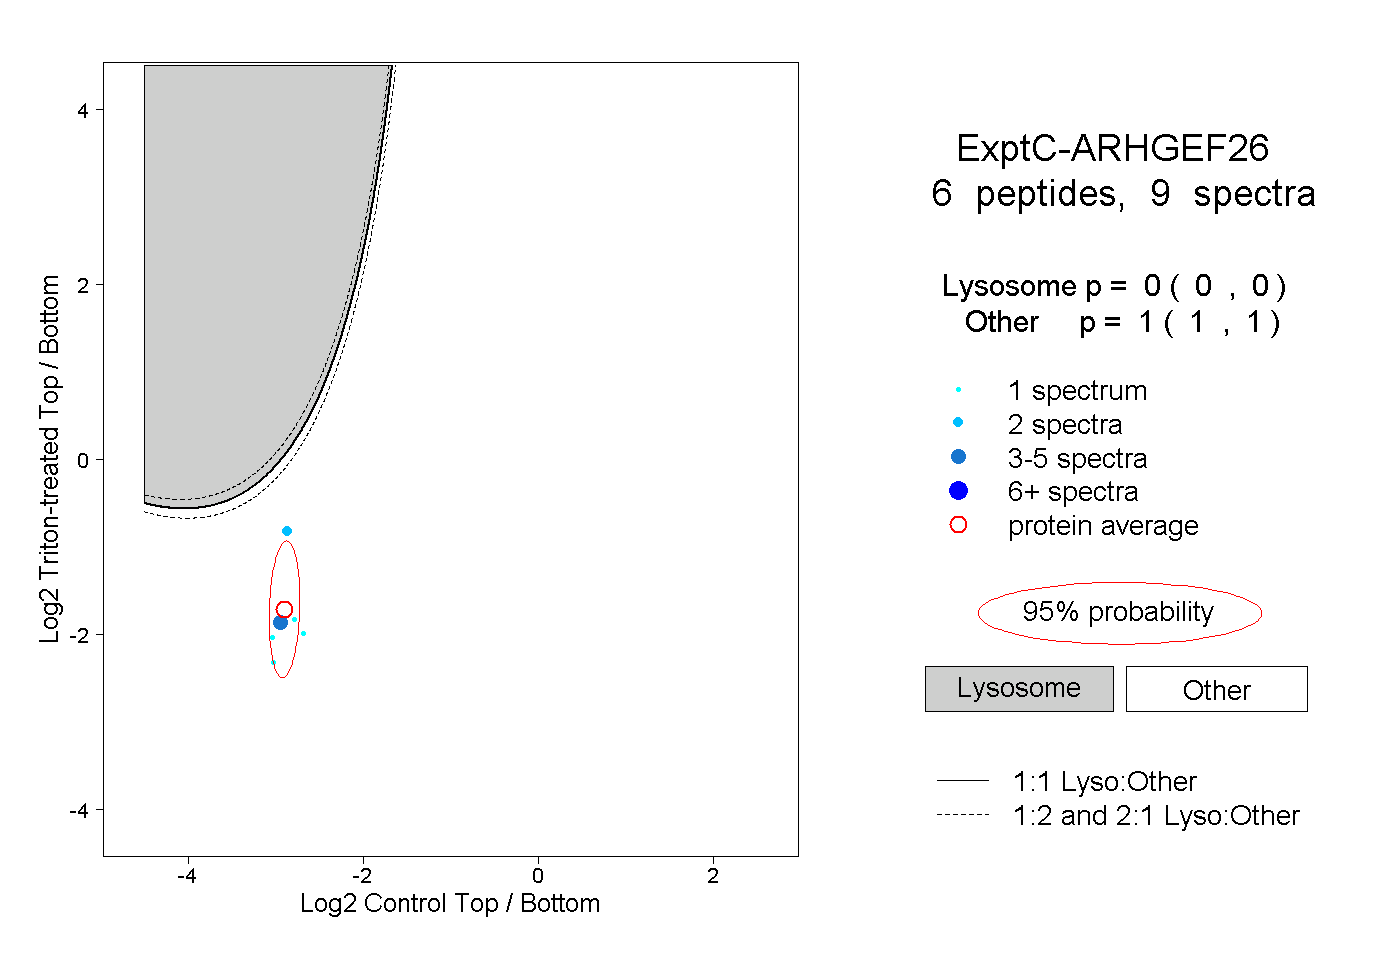
0.000 | 0.000
1.000 | 1.000