 5
5peptides
spectra
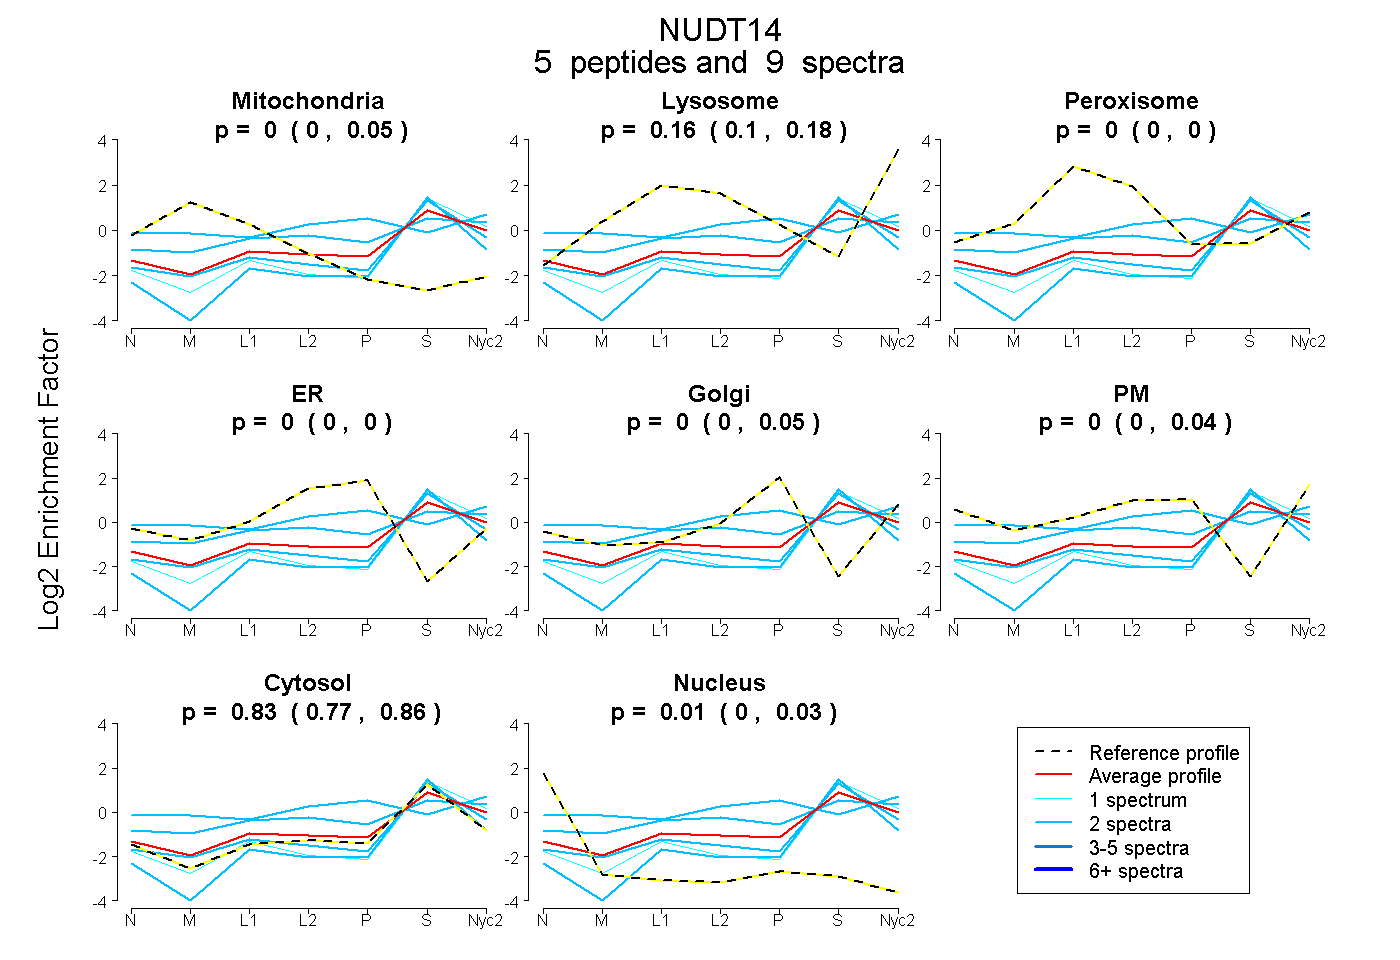
0.000 | 0.049
0.099 | 0.179
0.000 | 0.000
0.000 | 0.000
0.000 | 0.052
0.000 | 0.036
0.771 | 0.865
0.000 | 0.030
| Plot | Mito | Lyso | Perox | ER | Golgi | PM | Cytosol | Nucleus | |||||
| Expt A |
5 peptides |
9 spectra |
|
0.000 0.000 | 0.049 |
0.161 0.099 | 0.179 |
0.000 0.000 | 0.000 |
0.000 0.000 | 0.000 |
0.000 0.000 | 0.052 |
0.000 0.000 | 0.036 |
0.828 0.771 | 0.865 |
0.011 0.000 | 0.030 |
| 2 spectra, QTMFYAEVTDAQR | 0.013 | 0.144 | 0.115 | 0.000 | 0.000 | 0.141 | 0.587 | 0.000 | ||
| 2 spectra, THDSVTILMFNSSQR | 0.000 | 0.046 | 0.159 | 0.000 | 0.116 | 0.354 | 0.325 | 0.000 | ||
| 2 spectra, SWDFMK | 0.000 | 0.000 | 0.000 | 0.000 | 0.000 | 0.000 | 1.000 | 0.000 | ||
| 2 spectra, VATYMSGVGLTGSR | 0.012 | 0.051 | 0.000 | 0.000 | 0.000 | 0.000 | 0.937 | 0.000 | ||
| 1 spectrum, QFRPAVYAGEVER | 0.000 | 0.012 | 0.000 | 0.000 | 0.000 | 0.000 | 0.988 | 0.000 |
| Plot | Lyso | Other | |||||||||||
| Expt C |
3 peptides |
7 spectra |
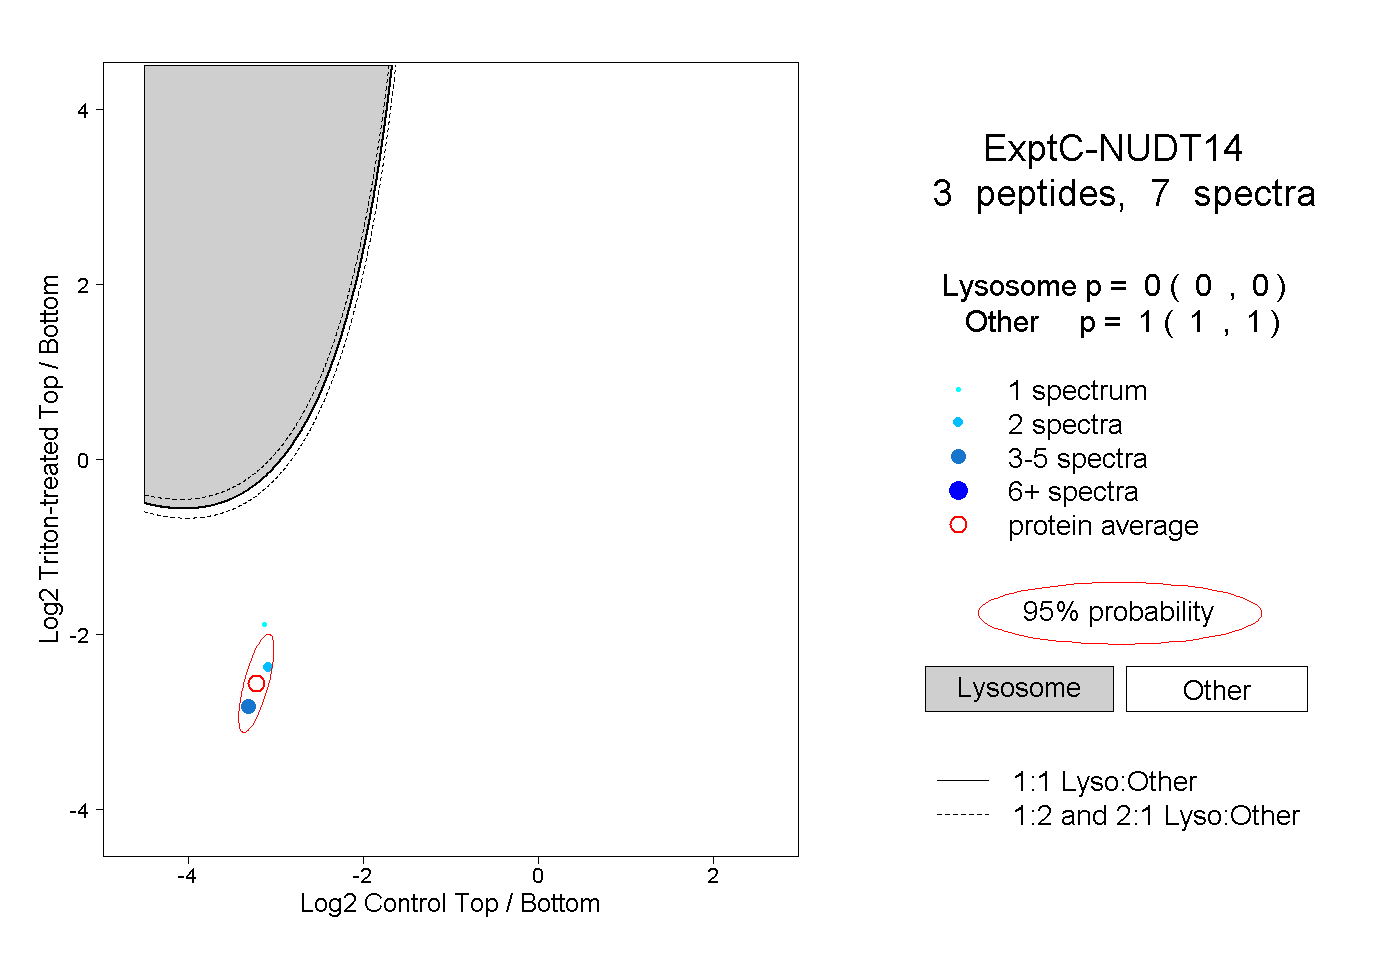 |
0.000 0.000 | 0.000 |
1.000 1.000 | 1.000 |