 2
2peptides
spectra
0.000 | 0.000
0.000 | 0.250
0.078 | 0.320
0.000 | 0.168
0.000 | 0.119
0.299 | 0.534
0.092 | 0.146
0.000 | 0.000
4peptides
spectra
0.000 | 0.000
1.000 | 1.000
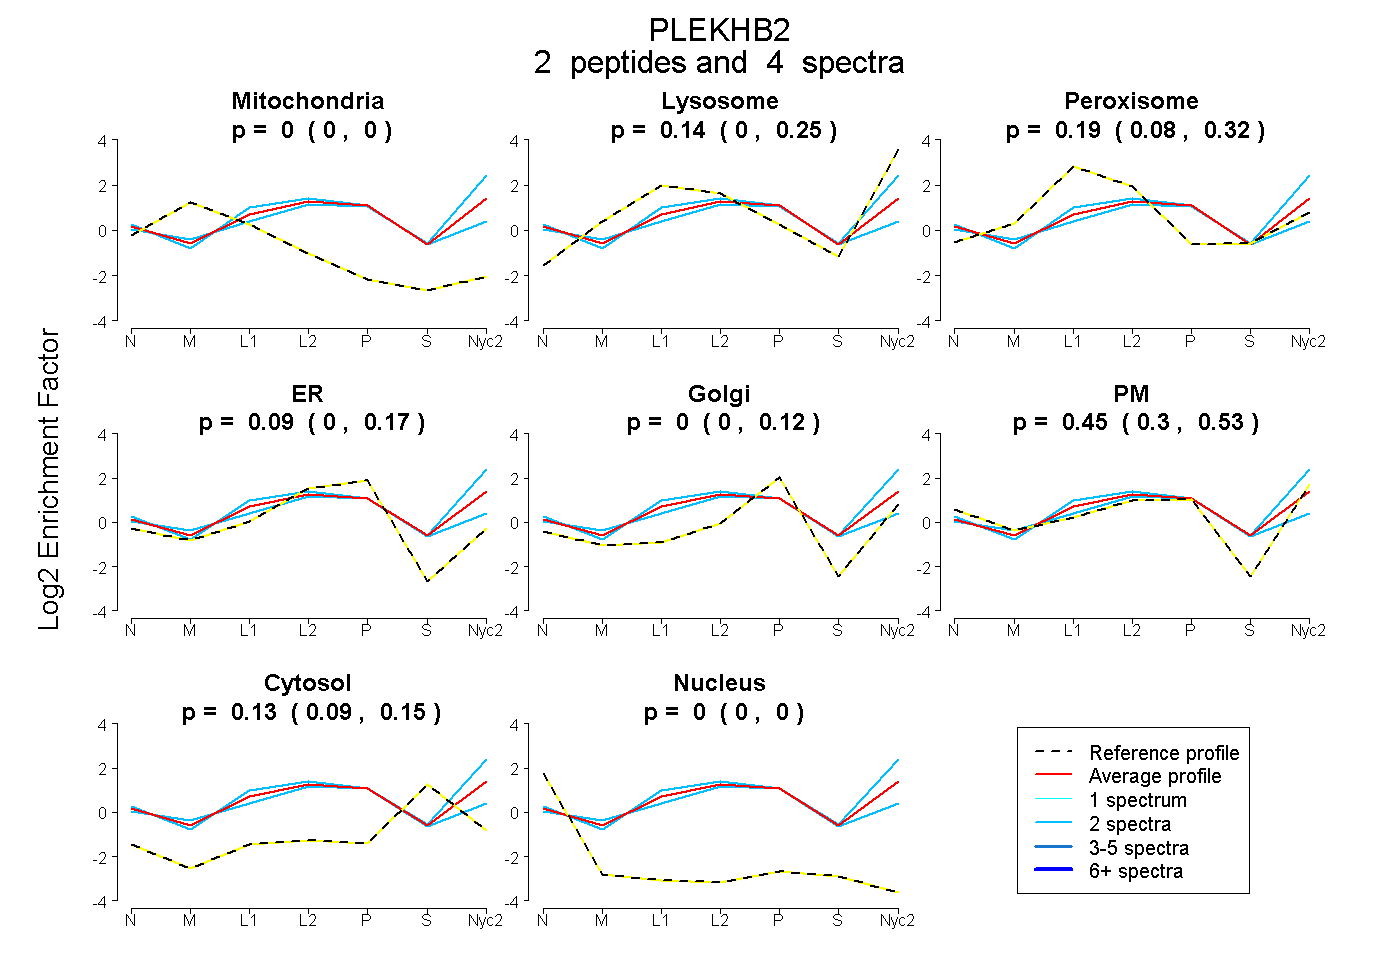
| Plot | Mito | Lyso | Perox | ER | Golgi | PM | Cytosol | Nucleus | |||||
| Expt A |
2 peptides |
4 spectra |
|
0.000 0.000 | 0.000 |
0.136 0.000 | 0.250 |
0.190 0.078 | 0.320 |
0.092 0.000 | 0.168 |
0.000 0.000 | 0.119 |
0.452 0.299 | 0.534 |
0.130 0.092 | 0.146 |
0.000 0.000 | 0.000 |
||
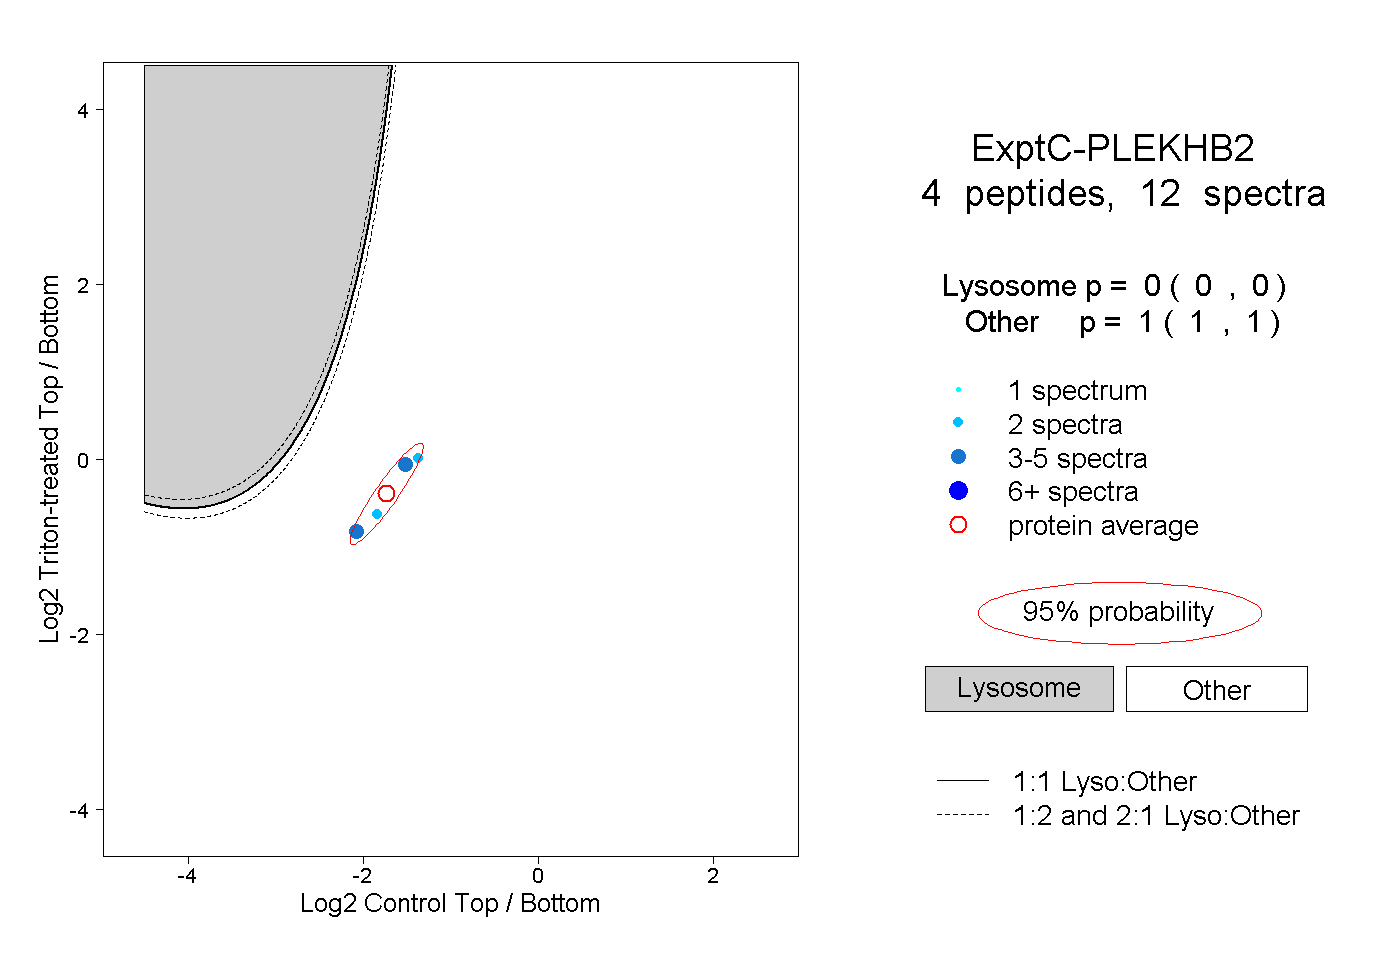
| Plot | Lyso | Other | |||||||||||
| Expt C |
4 peptides |
12 spectra |
|
0.000 0.000 | 0.000 |
1.000 1.000 | 1.000 |