ARPC5L
[ENSRNOP00000019405]
Main page
| | | Plot |
Mito |
Lyso |
|
Perox |
ER |
Golgi |
PM |
Cytosol |
Nucleus |
|
| Expt A |
 6
6
peptides |
27
spectra |
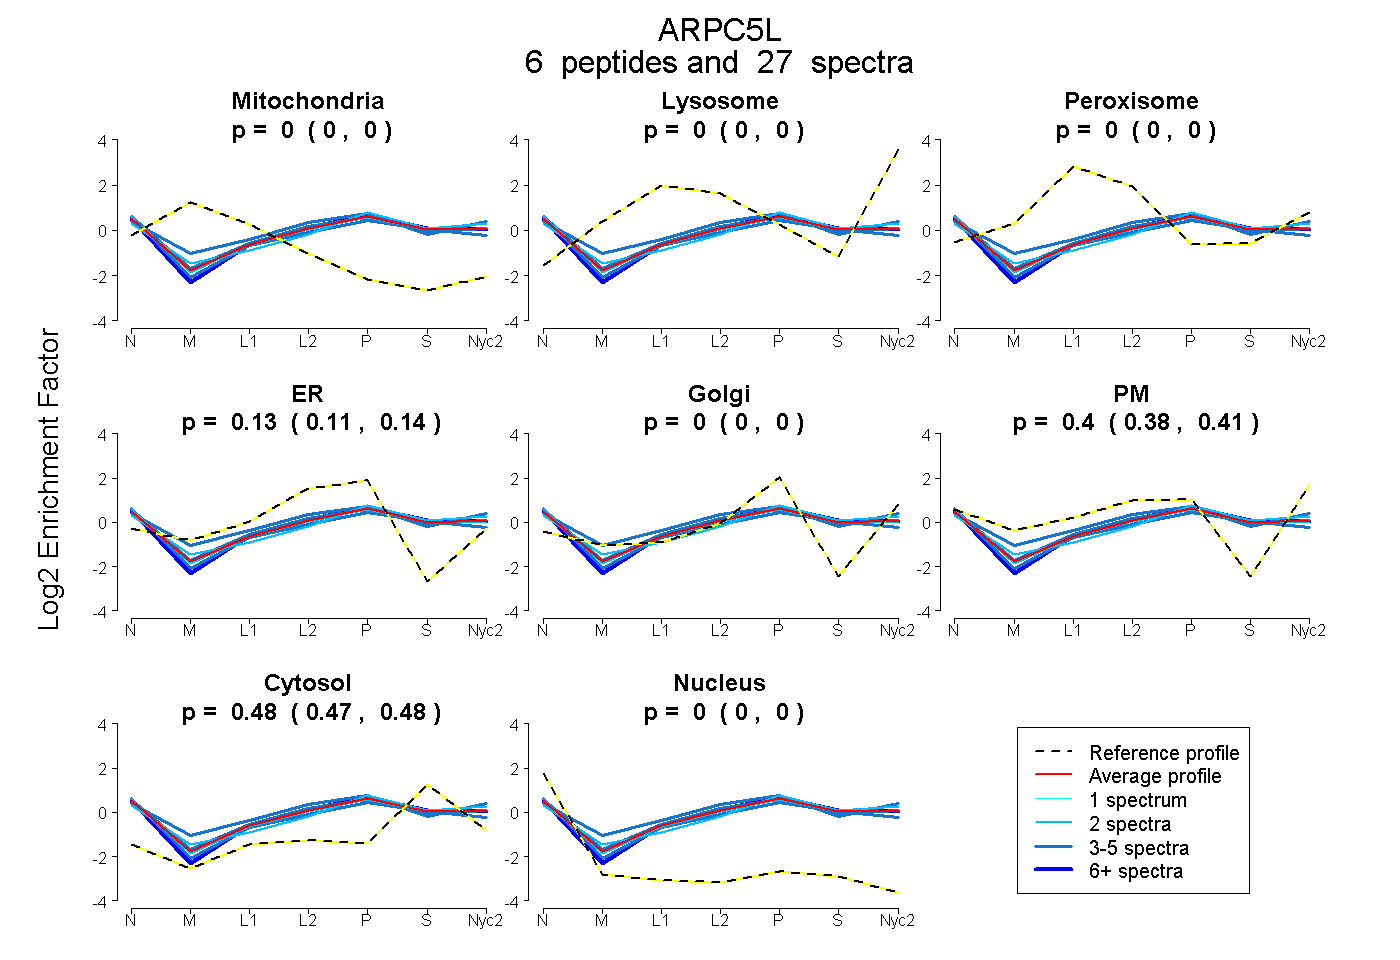 |
0.000
0.000 | 0.000 |
0.000
0.000 | 0.000 |
|
0.000
0.000 | 0.000 |
0.127
0.114 | 0.137 |
0.000
0.000 | 0.000 |
0.396
0.382 | 0.407 |
0.478
0.473 | 0.481 |
0.000
0.000 | 0.000 |
|
| | | Plot |
Mito |
|
Lyso or Perox |
|
ER |
Golgi |
PM |
Cytosol |
Nucleus |
|
| Expt B |
5
peptides |
11
spectra |
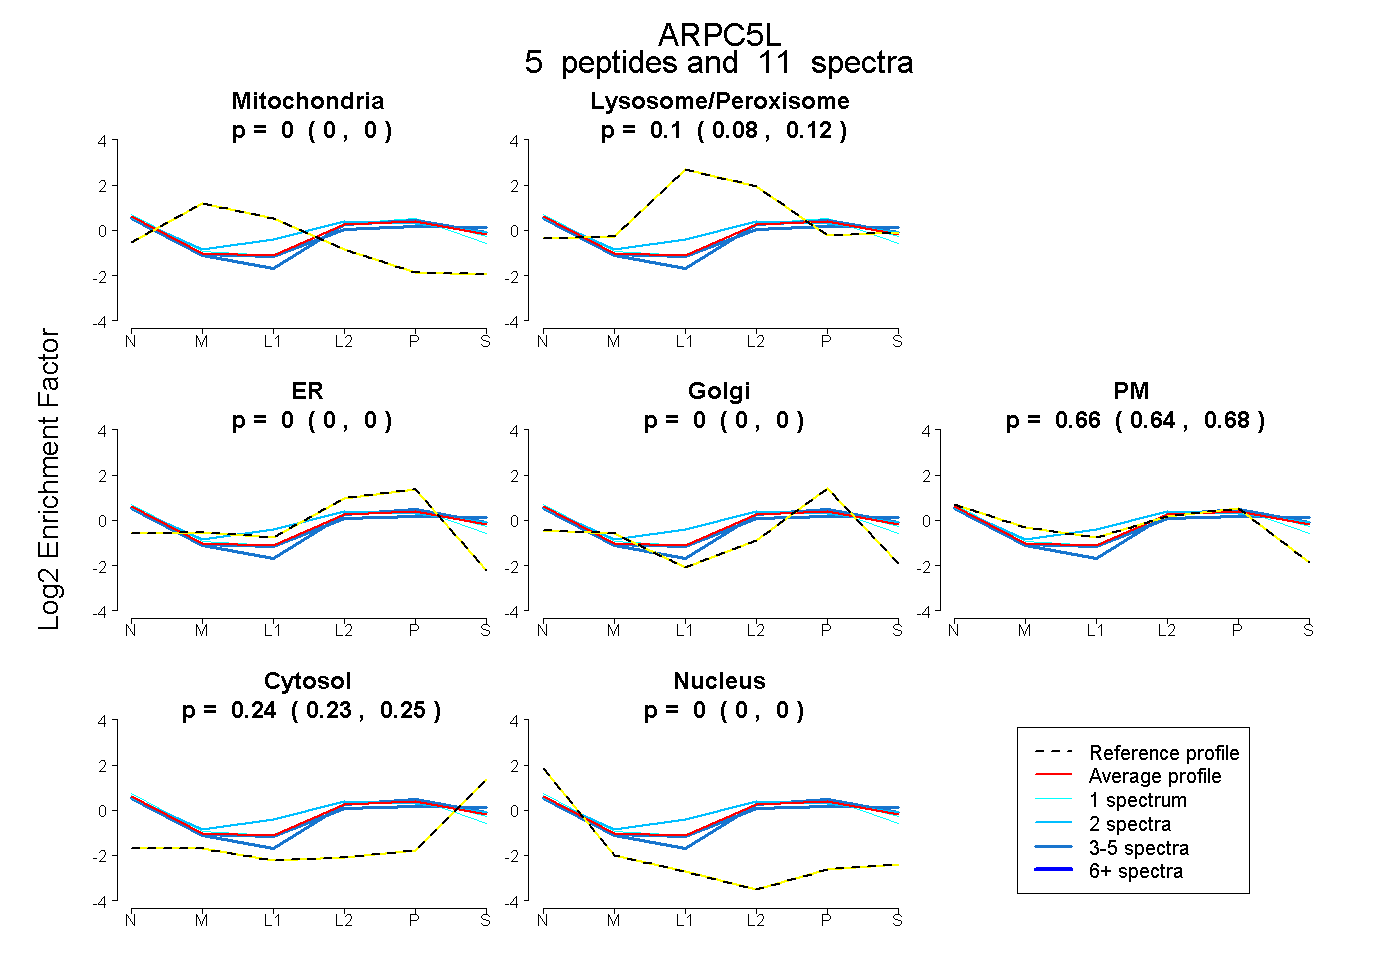 |
0.000
0.000 | 0.000 |
|
0.100
0.076 | 0.119 |
|
0.000
0.000 | 0.000 |
0.000
0.000 | 0.000 |
0.663
0.642 | 0.681 |
0.237
0.226 | 0.246 |
0.000
0.000 | 0.000 |
|
| 2 spectra, VLTNFK |
0.000 |
|
0.245 |
|
0.000 |
0.000 |
0.554 |
0.201 |
0.000 |
|
| 4 spectra, VLTAR |
0.000 |
|
0.109 |
|
0.000 |
0.000 |
0.586 |
0.305 |
0.000 |
|
| 3 spectra, SSEIEQAVQSLDR |
0.000 |
|
0.004 |
|
0.065 |
0.000 |
0.647 |
0.283 |
0.000 |
|
| 1 spectrum, AQGIVLK |
0.000 |
|
0.092 |
|
0.000 |
0.000 |
0.690 |
0.218 |
0.000 |
|
| 1 spectrum, ALAVGGLGSIIR |
0.000 |
|
0.061 |
|
0.000 |
0.000 |
0.771 |
0.168 |
0.000 |
|
| | | Plot |
|
Lyso |
|
|
|
|
|
|
|
Other |
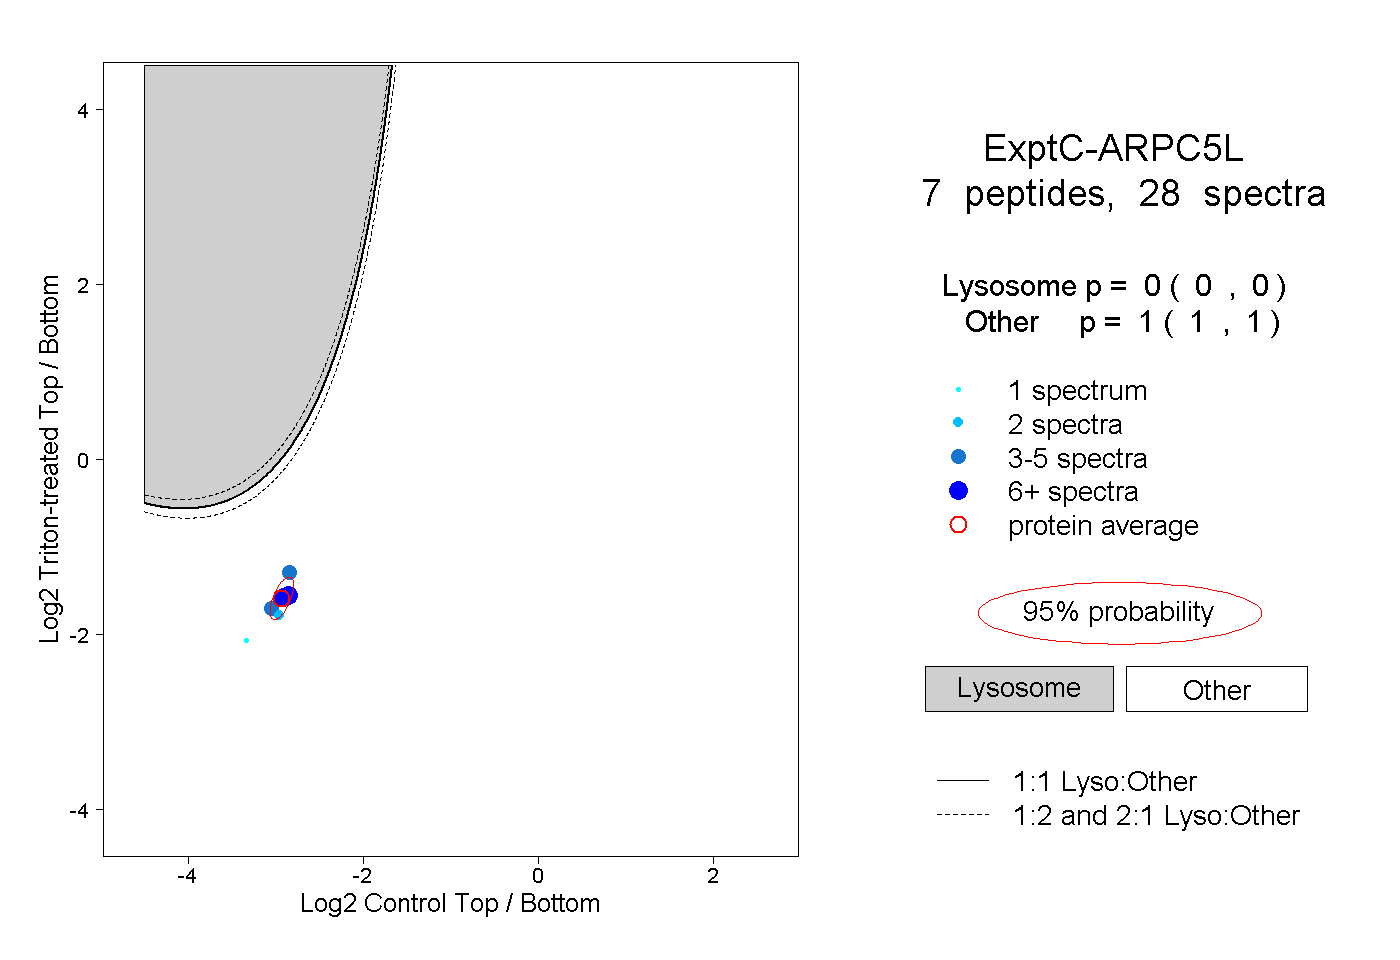
| Expt C |
7
peptides |
28
spectra |
 |
|
0.000
0.000 | 0.000 |
|
|
|
|
|
|
|
1.000
1.000 | 1.000 |
| | | Plot |
|
Lyso |
|
|
|
|
|
|
|
Other |
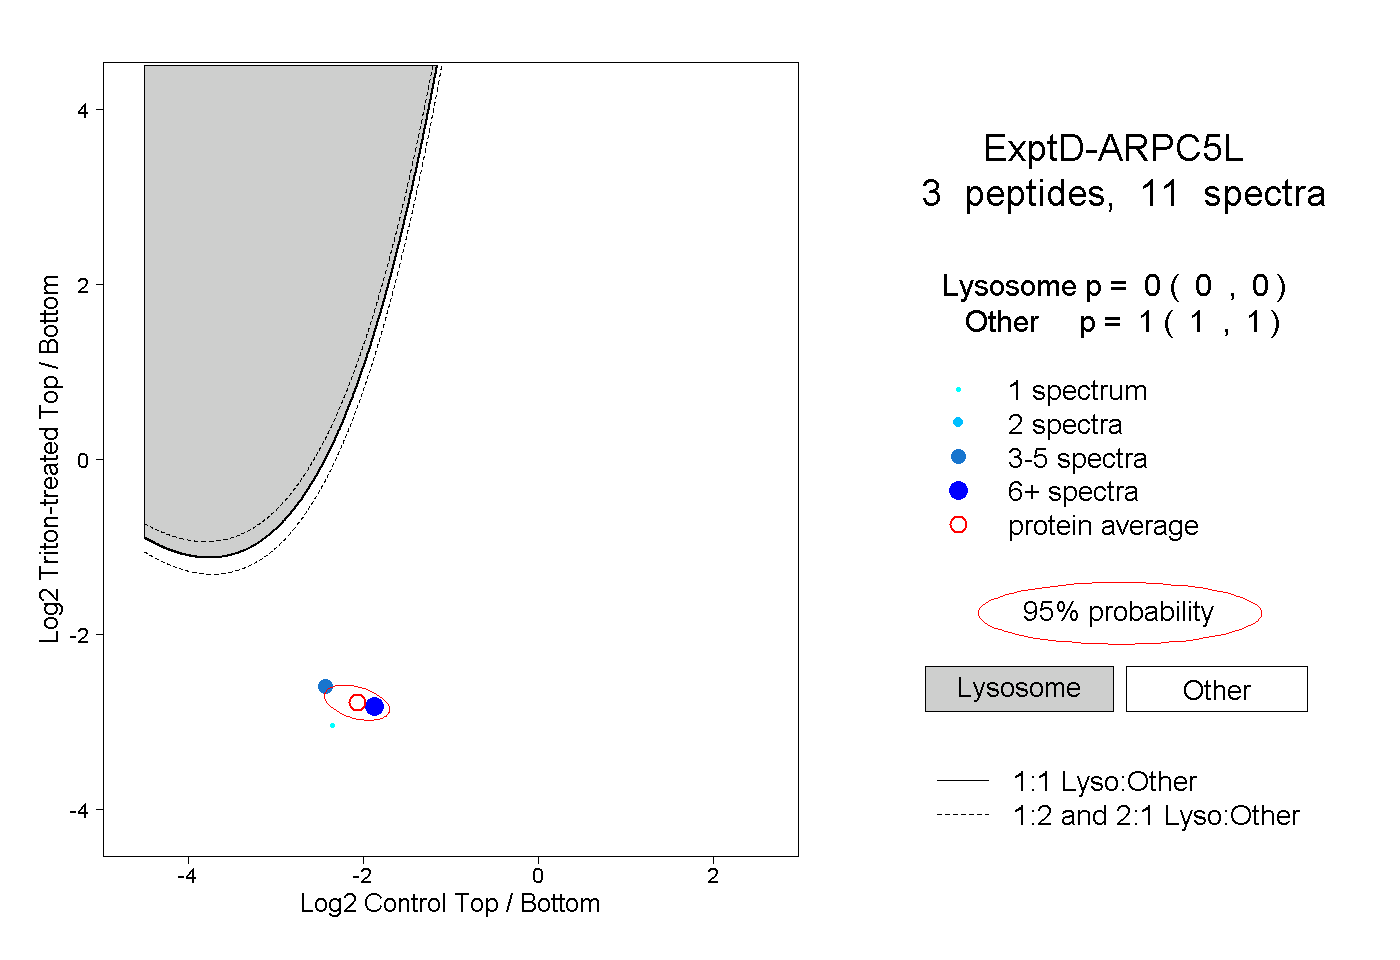
| Expt D |
3
peptides |
11
spectra |
 |
|
0.000
0.000 | 0.000 |
|
|
|
|
|
|
|
1.000
1.000 | 1.000 |