 6
6peptides
spectra
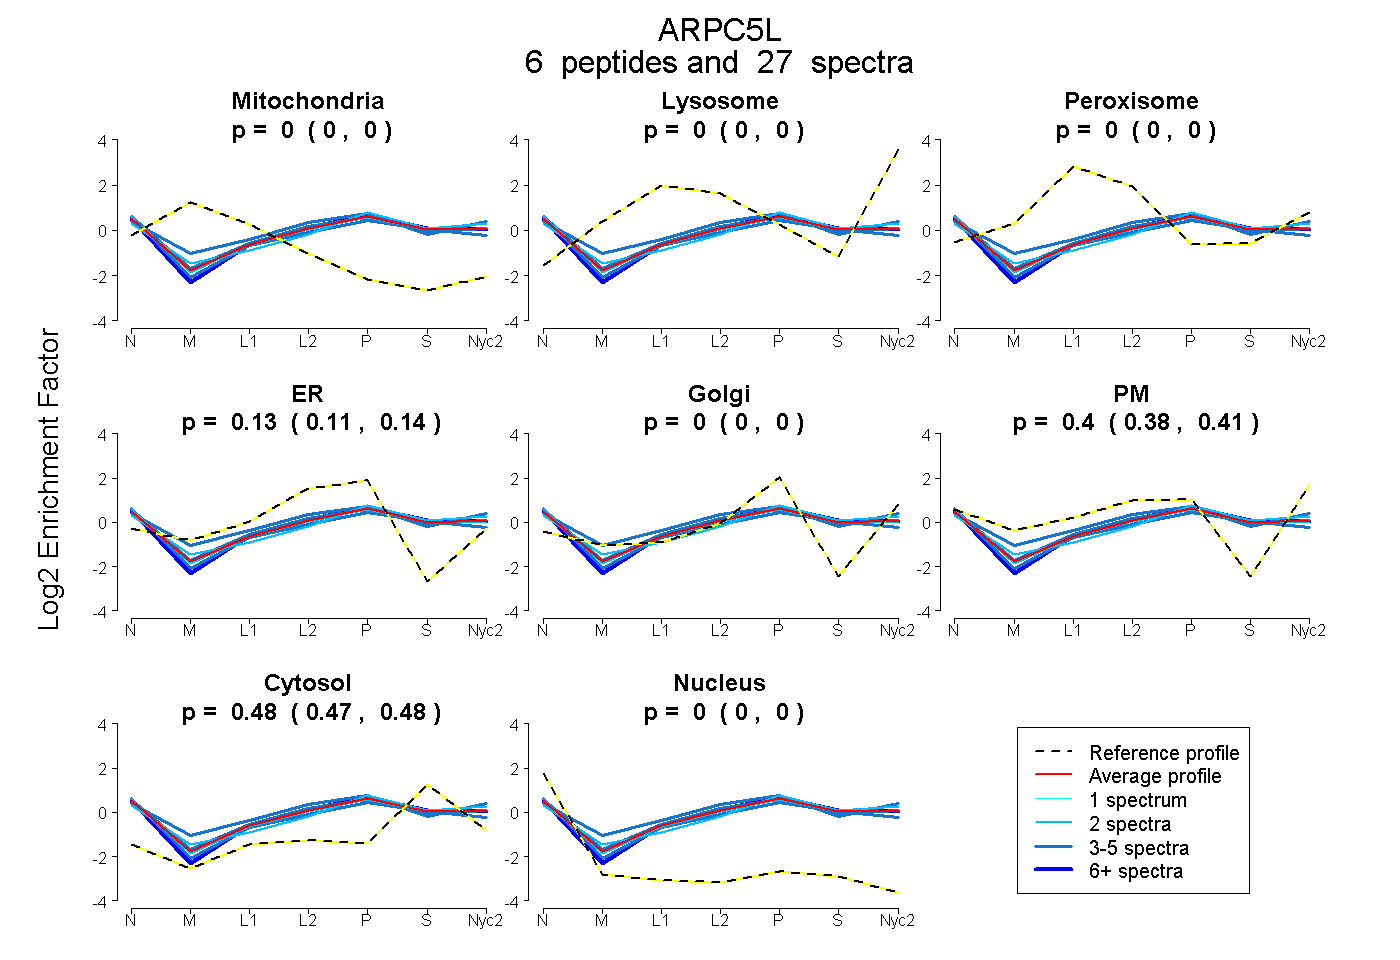
0.000 | 0.000
0.000 | 0.000
0.000 | 0.000
0.114 | 0.137
0.000 | 0.000
0.382 | 0.407
0.473 | 0.481
0.000 | 0.000
| Plot | Mito | Lyso | Perox | ER | Golgi | PM | Cytosol | Nucleus | |||||
| Expt A |
6 peptides |
27 spectra |
|
0.000 0.000 | 0.000 |
0.000 0.000 | 0.000 |
0.000 0.000 | 0.000 |
0.127 0.114 | 0.137 |
0.000 0.000 | 0.000 |
0.396 0.382 | 0.407 |
0.478 0.473 | 0.481 |
0.000 0.000 | 0.000 |
| 2 spectra, VDIDEFDENK | 0.000 | 0.000 | 0.000 | 0.000 | 0.187 | 0.353 | 0.460 | 0.000 | ||
| 3 spectra, NGIDLLMK | 0.000 | 0.000 | 0.039 | 0.099 | 0.000 | 0.487 | 0.376 | 0.000 | ||
| 11 spectra, AFHAALR | 0.000 | 0.000 | 0.000 | 0.167 | 0.000 | 0.329 | 0.504 | 0.000 | ||
| 2 spectra, SSEIEQAVQSLDR | 0.000 | 0.000 | 0.000 | 0.118 | 0.000 | 0.391 | 0.480 | 0.011 | ||
| 4 spectra, AQGIVLK | 0.000 | 0.000 | 0.000 | 0.133 | 0.000 | 0.407 | 0.458 | 0.002 | ||
| 5 spectra, ALAVGGLGSIIR | 0.000 | 0.000 | 0.000 | 0.151 | 0.000 | 0.316 | 0.493 | 0.040 |
| Plot | Mito | Lyso or Perox | ER | Golgi | PM | Cytosol | Nucleus | ||||||
| Expt B |
5 peptides |
11 spectra |
 |
0.000 0.000 | 0.000 |
0.100 0.076 | 0.119 |
0.000 0.000 | 0.000 |
0.000 0.000 | 0.000 |
0.663 0.642 | 0.681 |
0.237 0.226 | 0.246 |
0.000 0.000 | 0.000 |
|||
| Plot | Lyso | Other | |||||||||||
| Expt C |
7 peptides |
28 spectra |
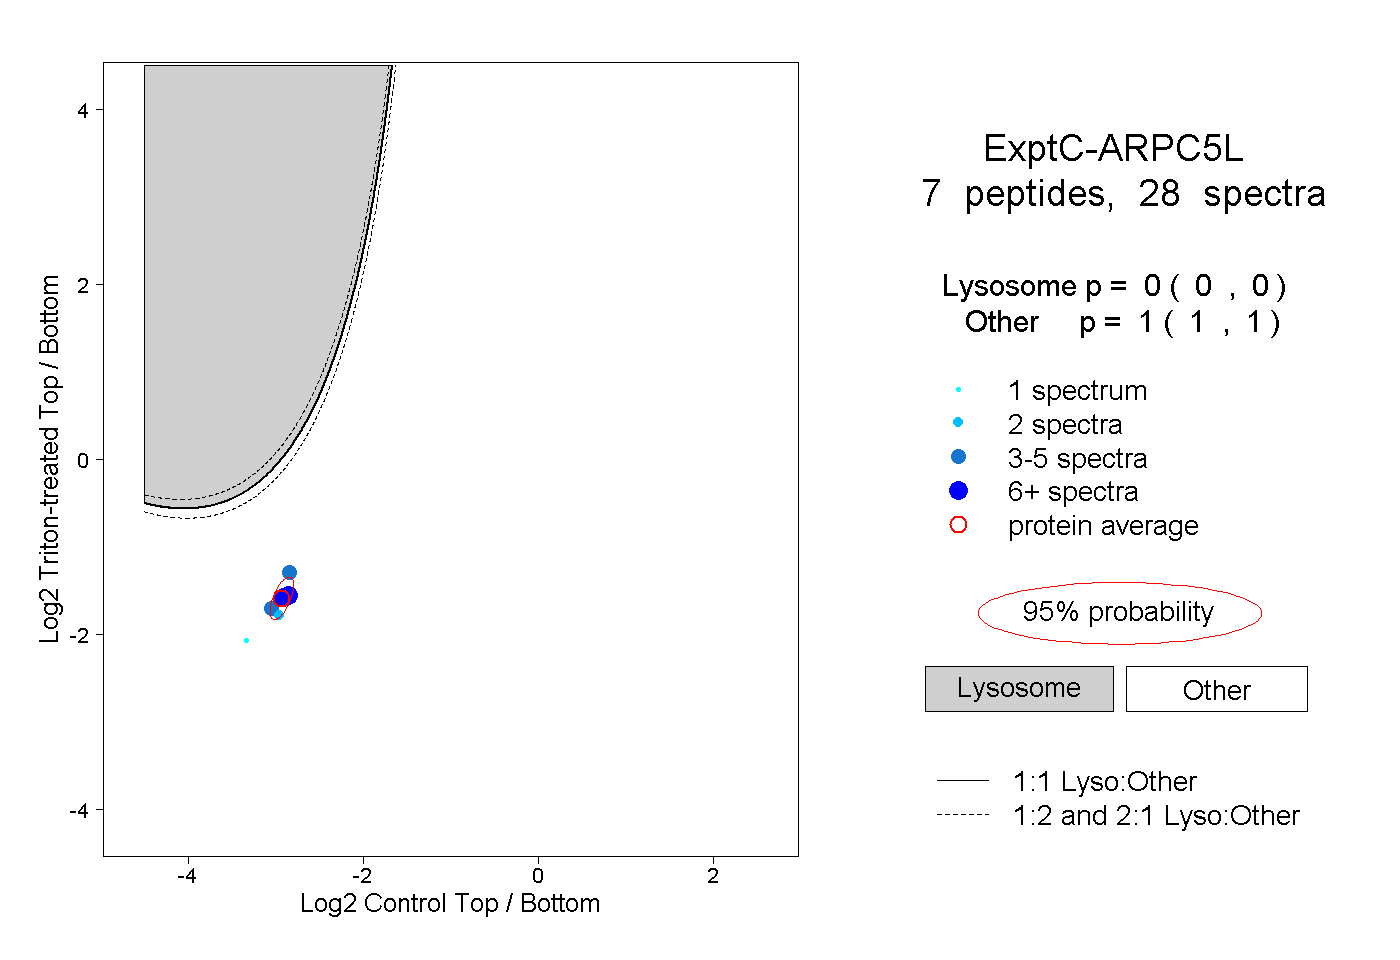 |
0.000 0.000 | 0.000 |
1.000 1.000 | 1.000 |
||||||||
| Plot | Lyso | Other | |||||||||||
| Expt D |
3 peptides |
11 spectra |
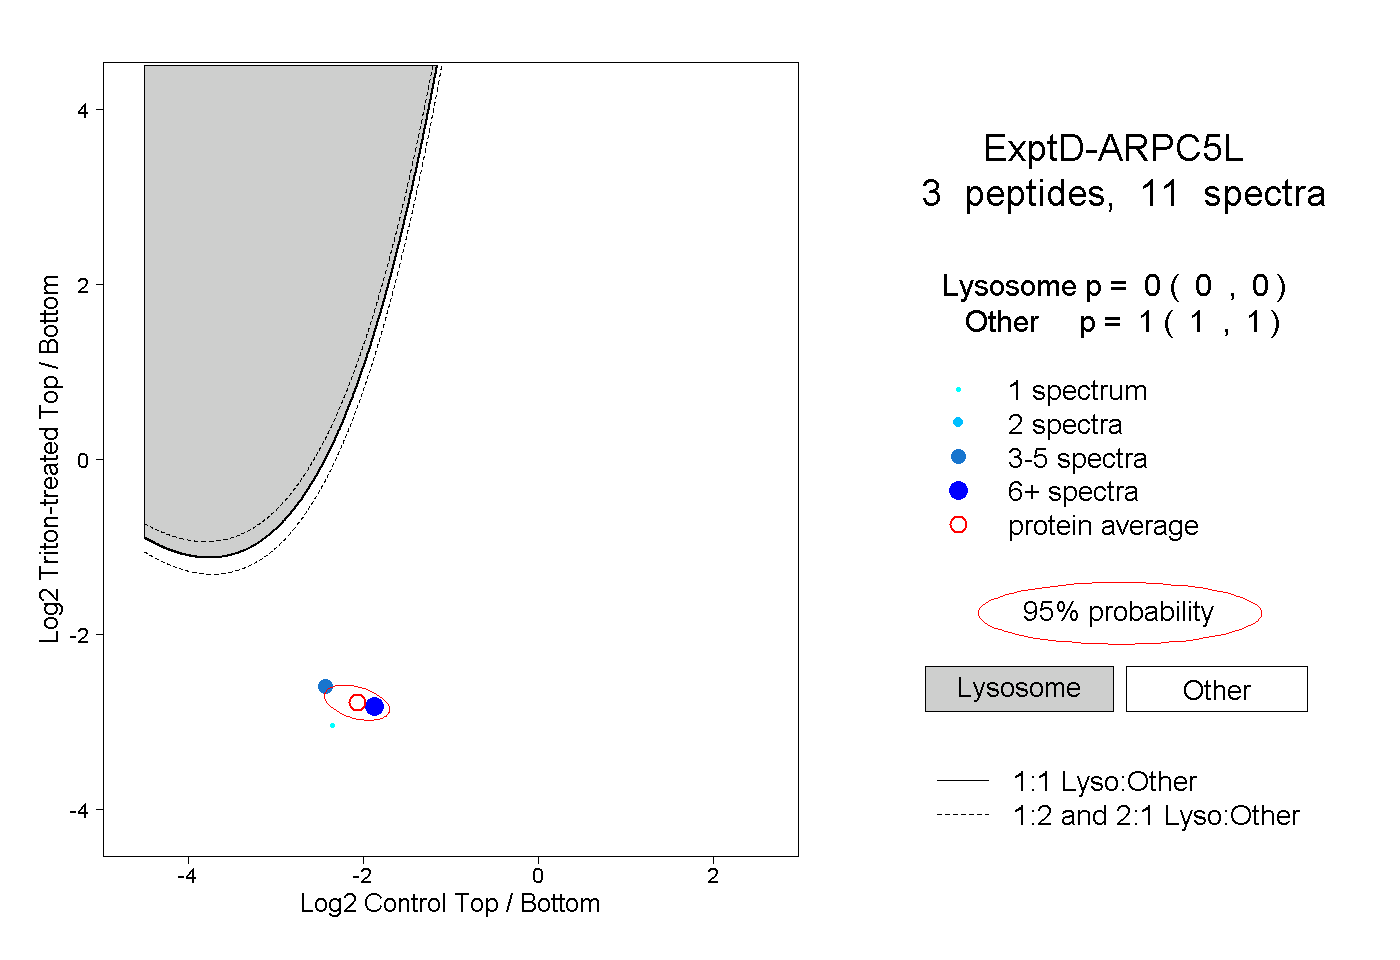 |
0.000 0.000 | 0.000 |
1.000 1.000 | 1.000 |