21
21peptides
spectra
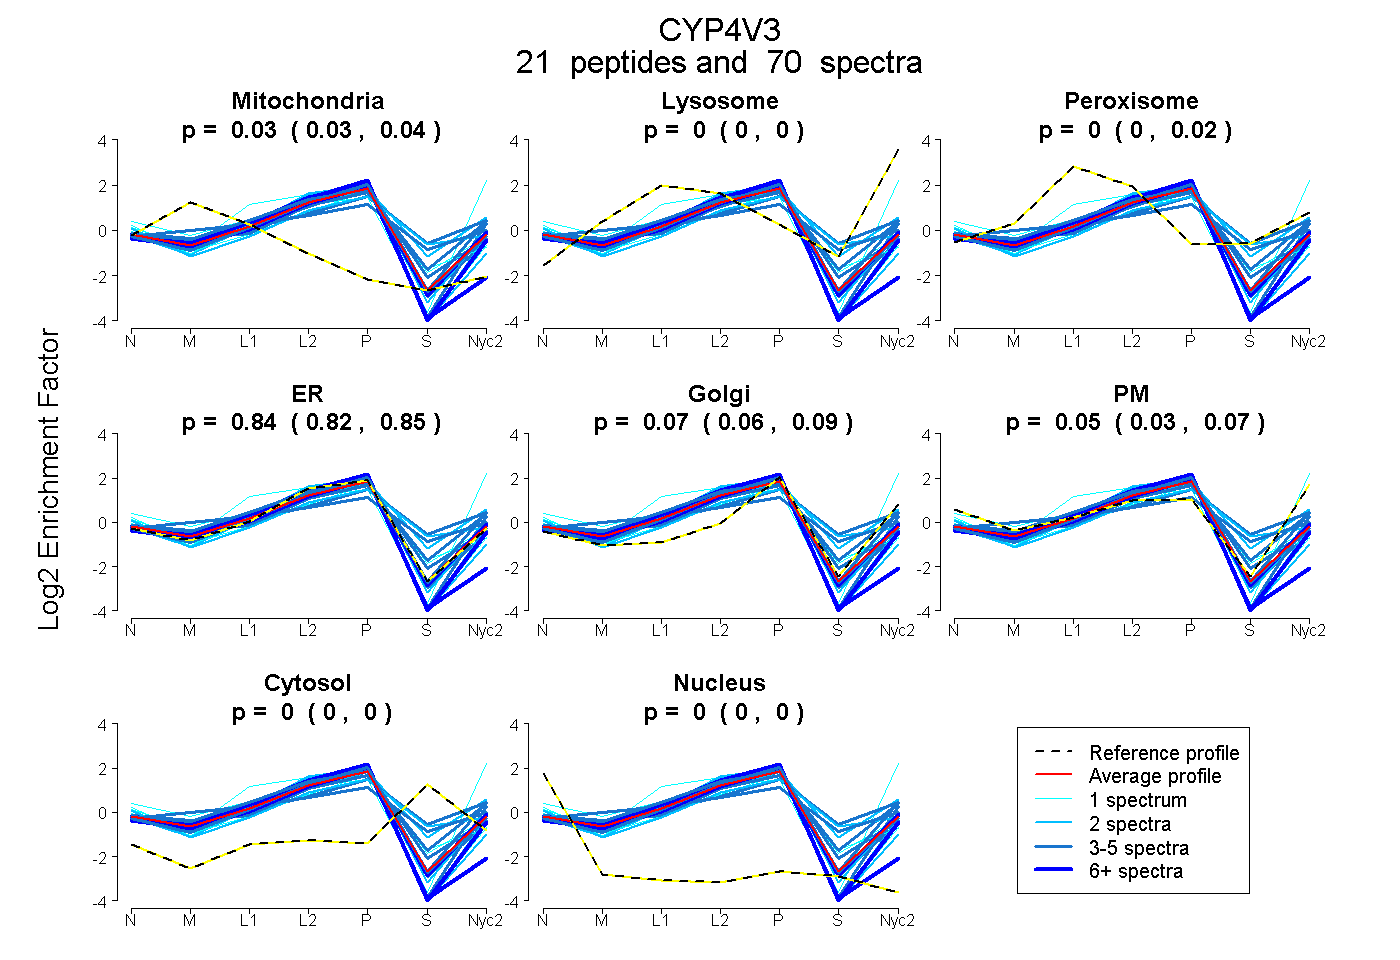
0.028 | 0.038
0.000 | 0.000
0.000 | 0.017
0.821 | 0.853
0.057 | 0.087
0.032 | 0.066
0.000 | 0.000
0.000 | 0.000
8peptides
spectra
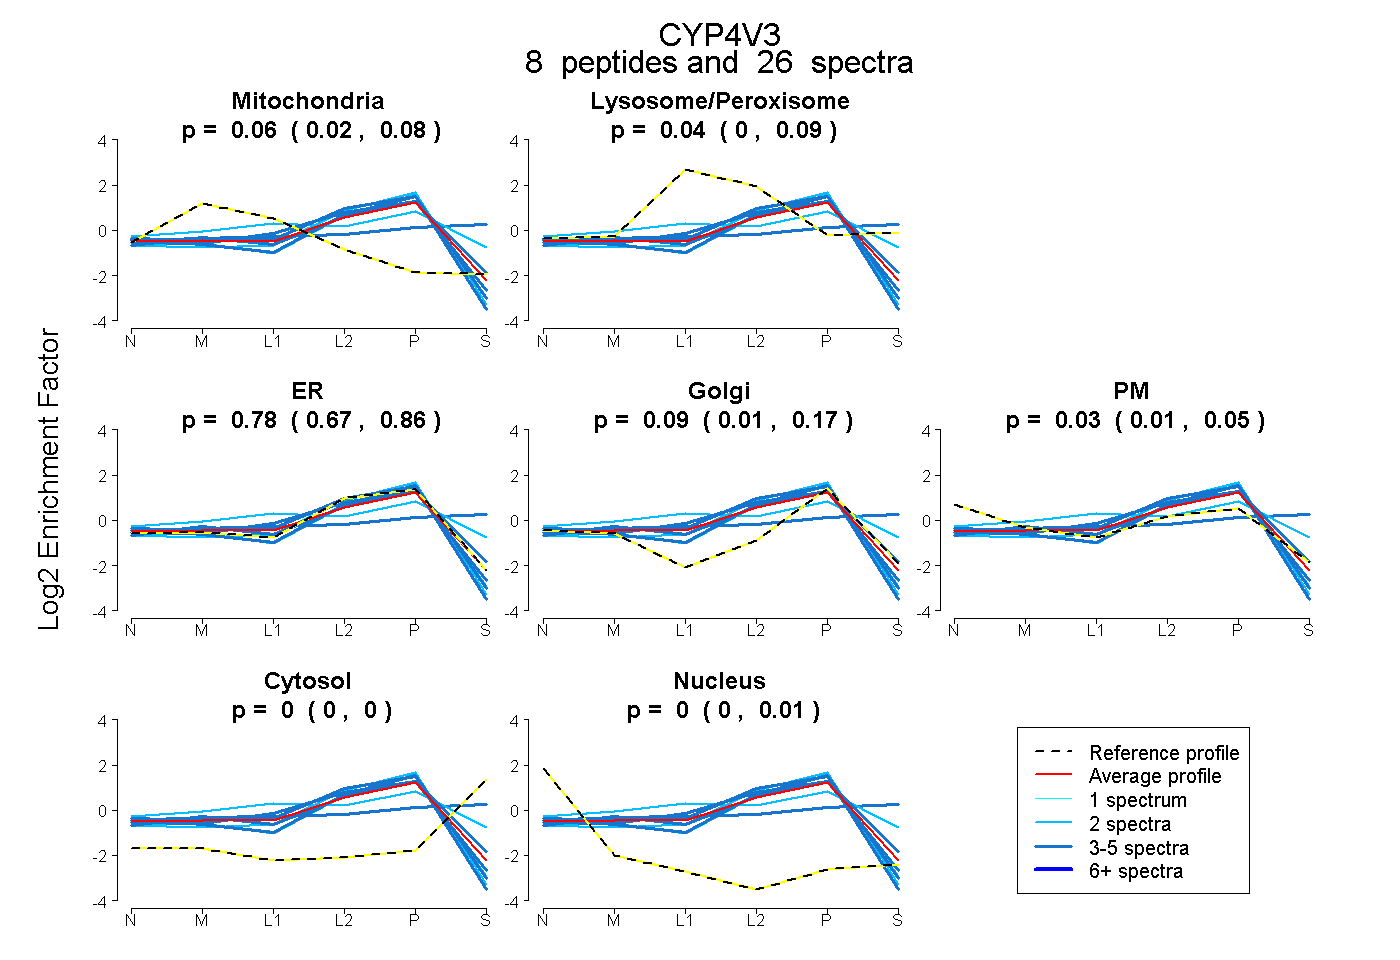
0.023 | 0.080
0.000 | 0.092
0.668 | 0.864
0.007 | 0.171
0.007 | 0.048
0.000 | 0.000
0.000 | 0.007
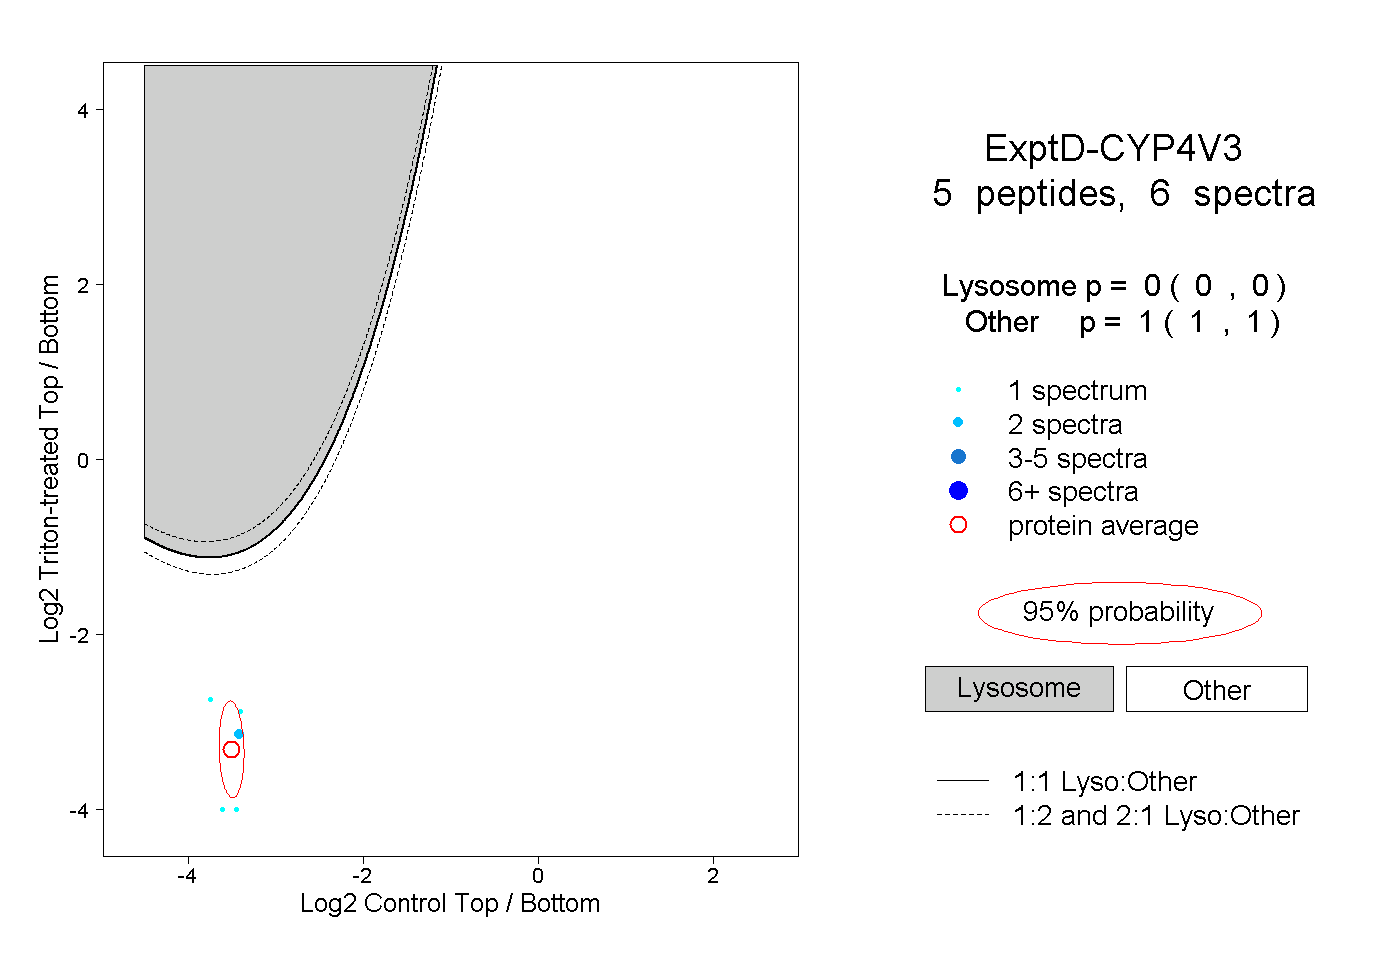
16peptides
spectra
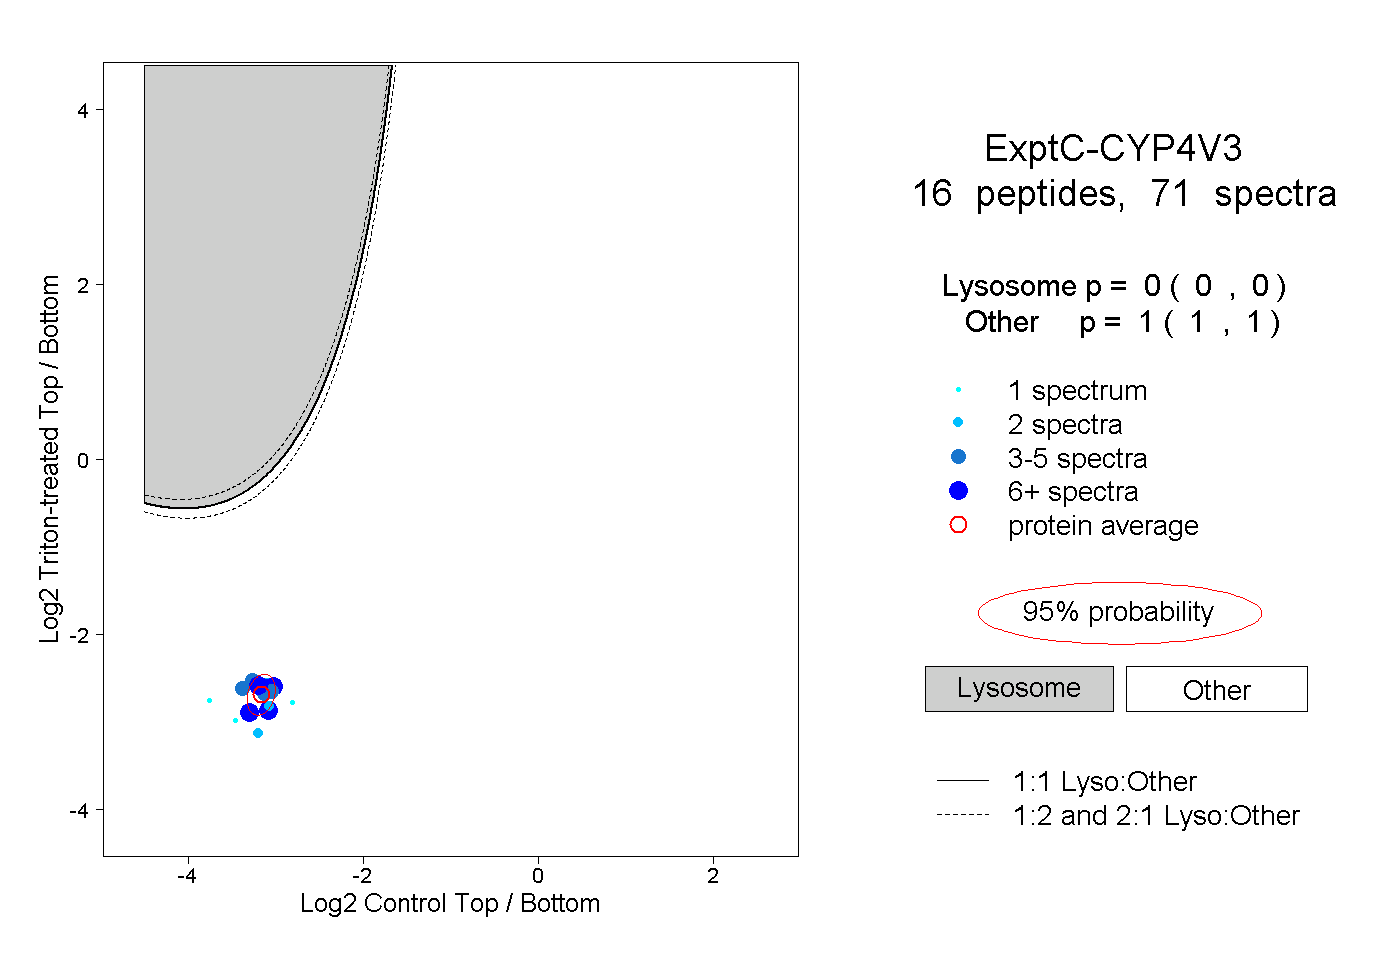
0.000 | 0.000
1.000 | 1.000