 2
2peptides
spectra
0.000 | 0.023
0.000 | 0.000
0.000 | 0.122
0.052 | 0.502
0.000 | 0.000
0.000 | 0.476
0.263 | 0.428
0.000 | 0.134
1peptide
spectrum
NA | NA
NA | NA
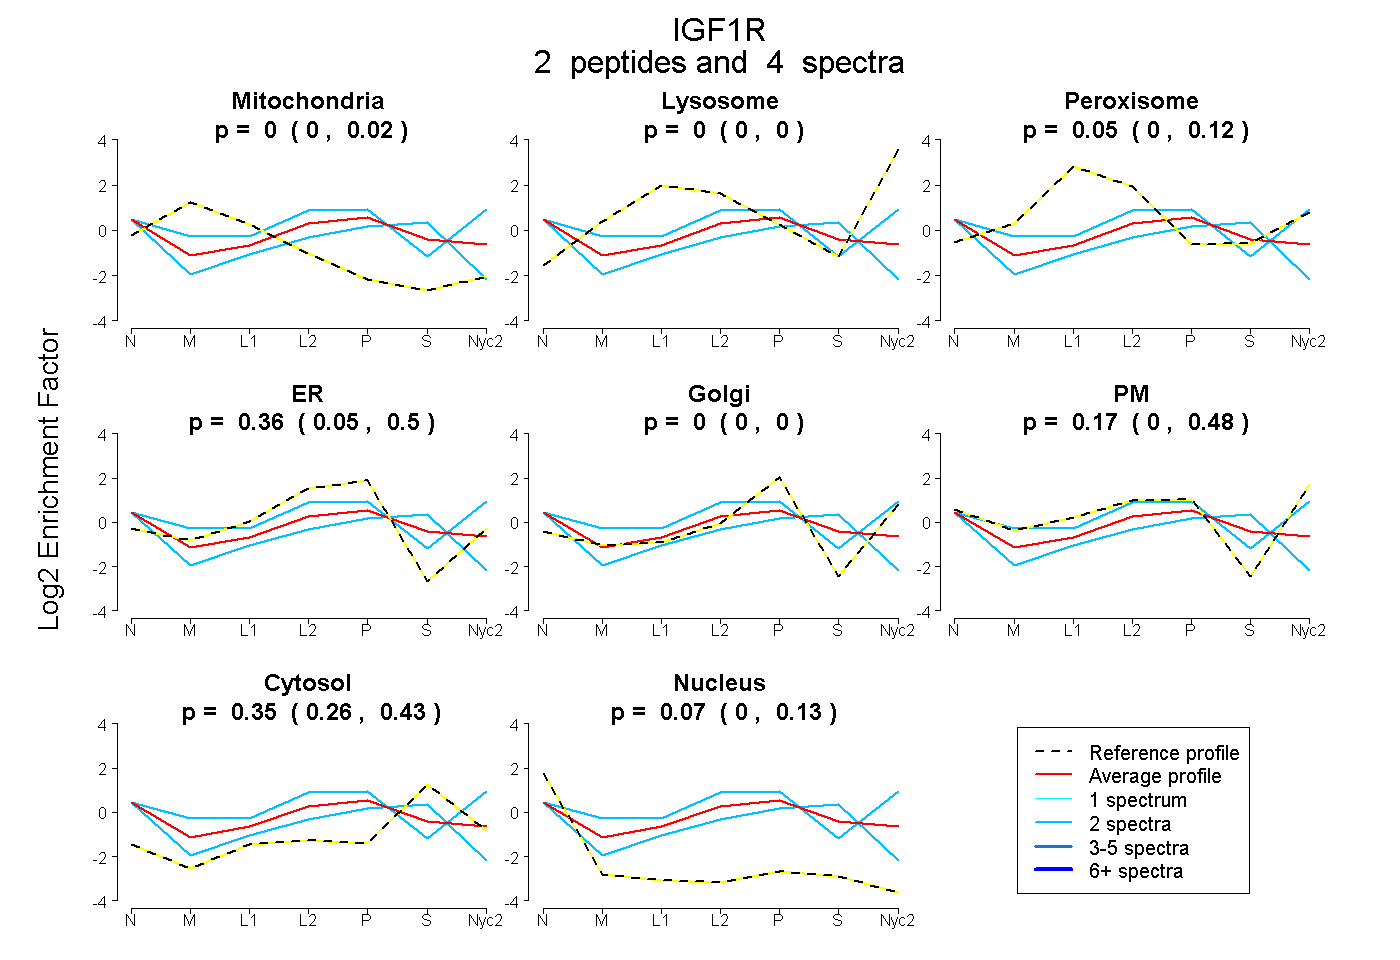
| Plot | Mito | Lyso | Perox | ER | Golgi | PM | Cytosol | Nucleus | |||||
| Expt A |
2 peptides |
4 spectra |
|
0.000 0.000 | 0.023 |
0.000 0.000 | 0.000 |
0.050 0.000 | 0.122 |
0.357 0.052 | 0.502 |
0.000 0.000 | 0.000 |
0.170 0.000 | 0.476 |
0.355 0.263 | 0.428 |
0.068 0.000 | 0.134 |
||
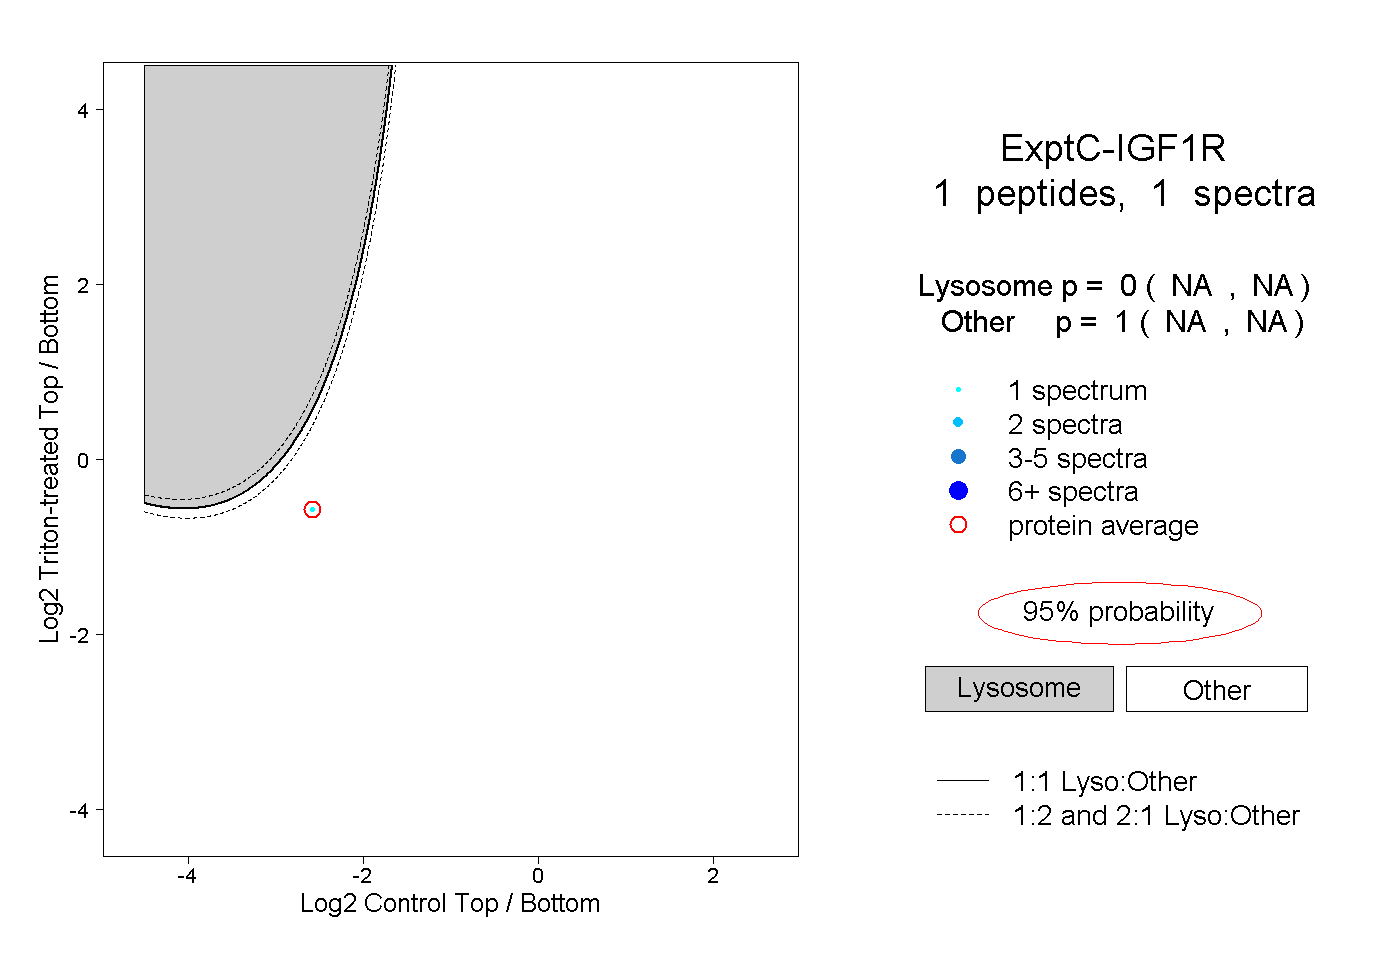
| Plot | Lyso | Other | |||||||||||
| Expt C |
1 peptide |
1 spectrum |
|
0.000 NA | NA |
1.000 NA | NA |