 6
6peptides
spectra
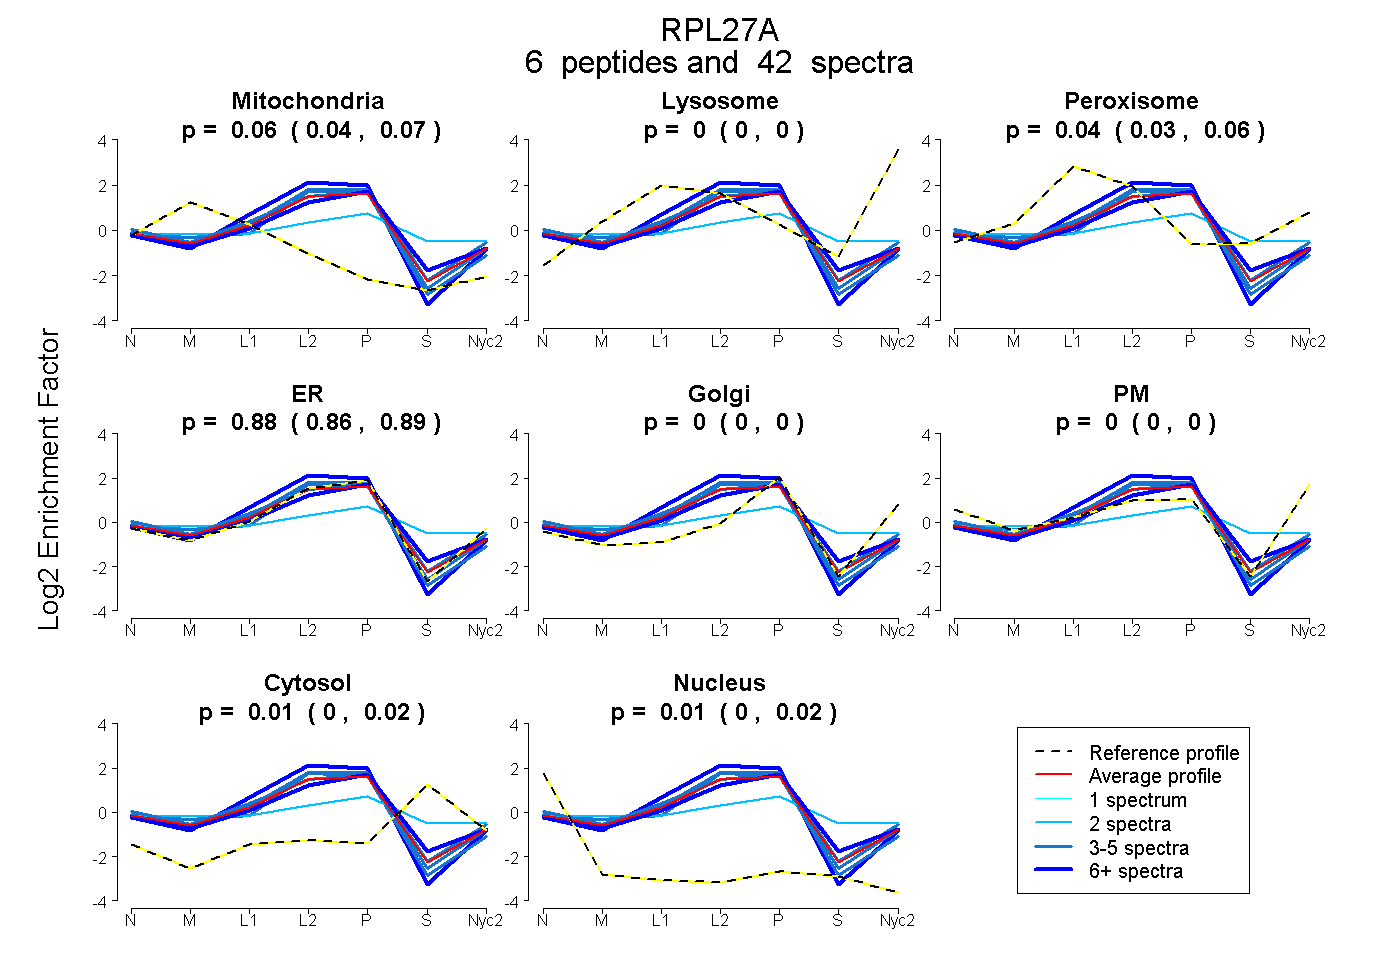
0.045 | 0.067
0.000 | 0.000
0.030 | 0.058
0.861 | 0.892
0.000 | 0.000
0.000 | 0.000
0.000 | 0.023
0.003 | 0.017
6peptides
spectra
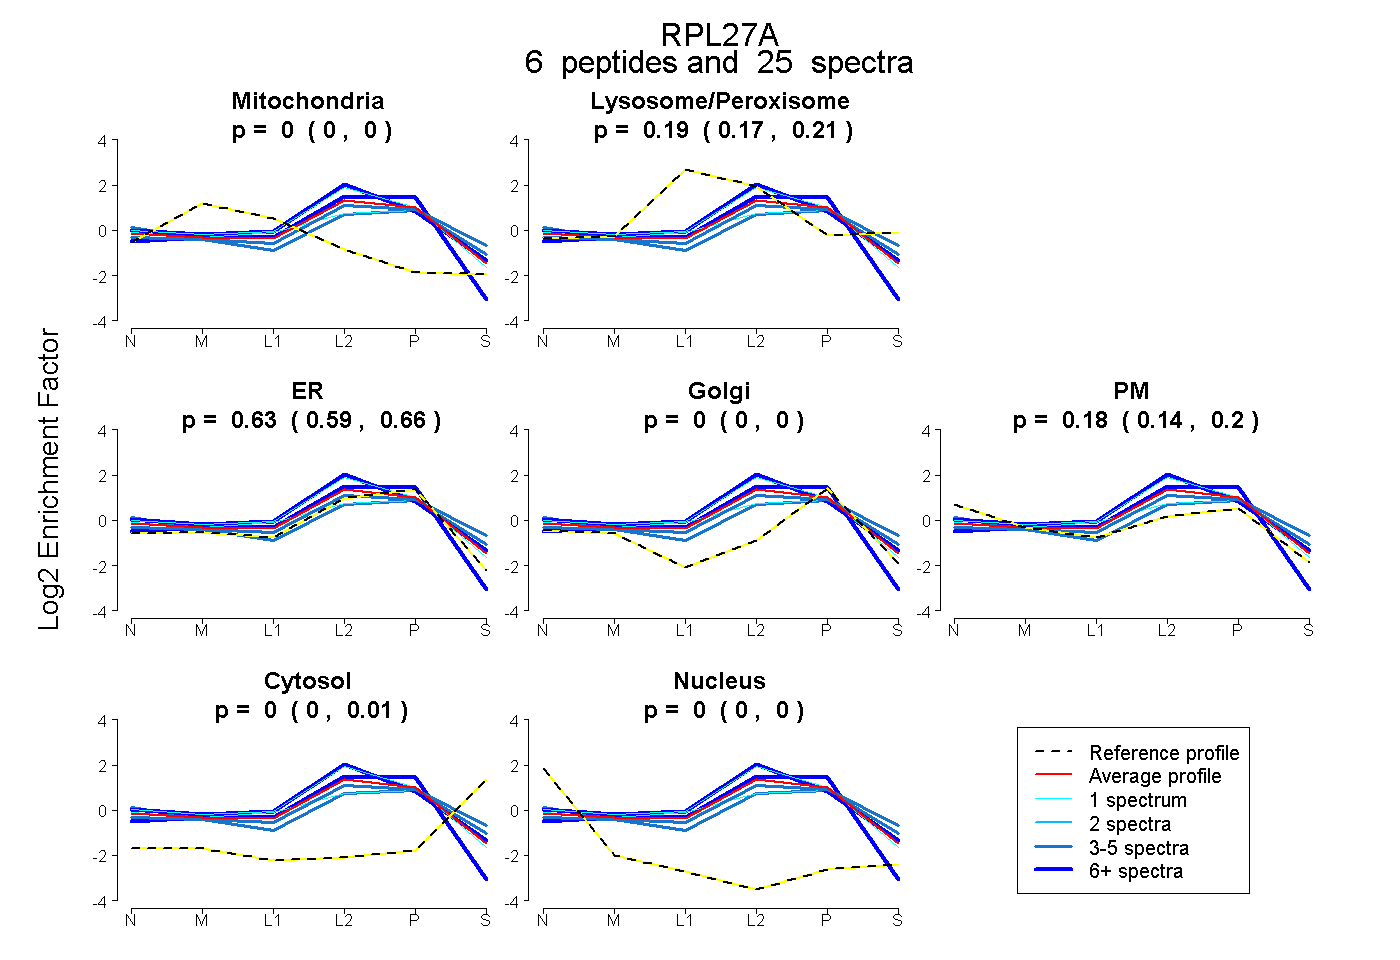
0.000 | 0.000
0.172 | 0.209
0.595 | 0.663
0.000 | 0.000
0.141 | 0.198
0.000 | 0.011
0.000 | 0.000
5peptides
spectra
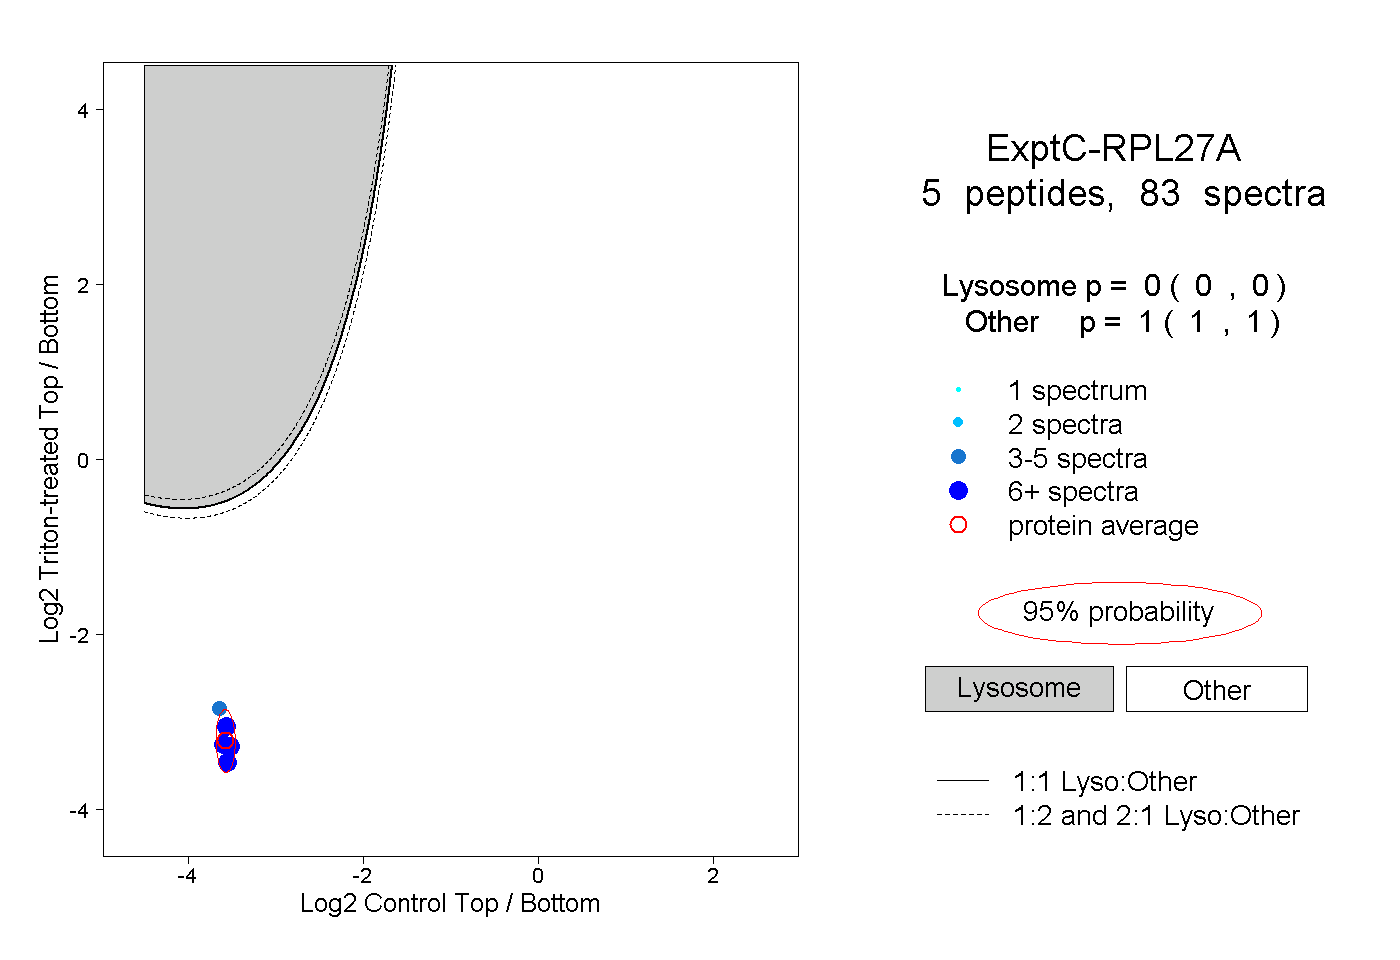
0.000 | 0.000
1.000 | 1.000
3peptides
spectra
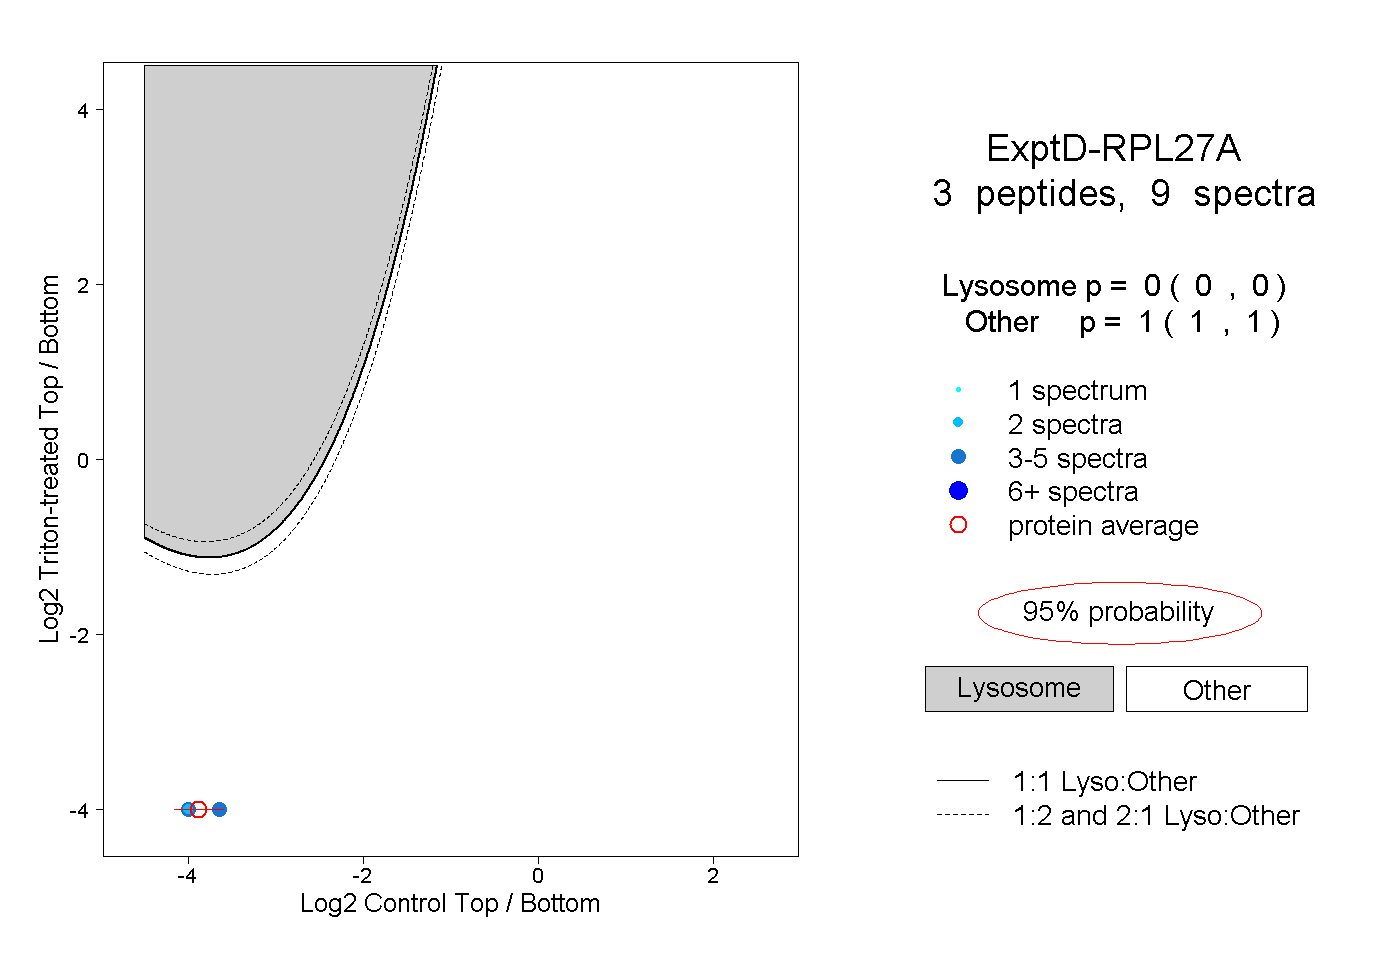
0.000 | 0.000
1.000 | 1.000