 18
18peptides
spectra
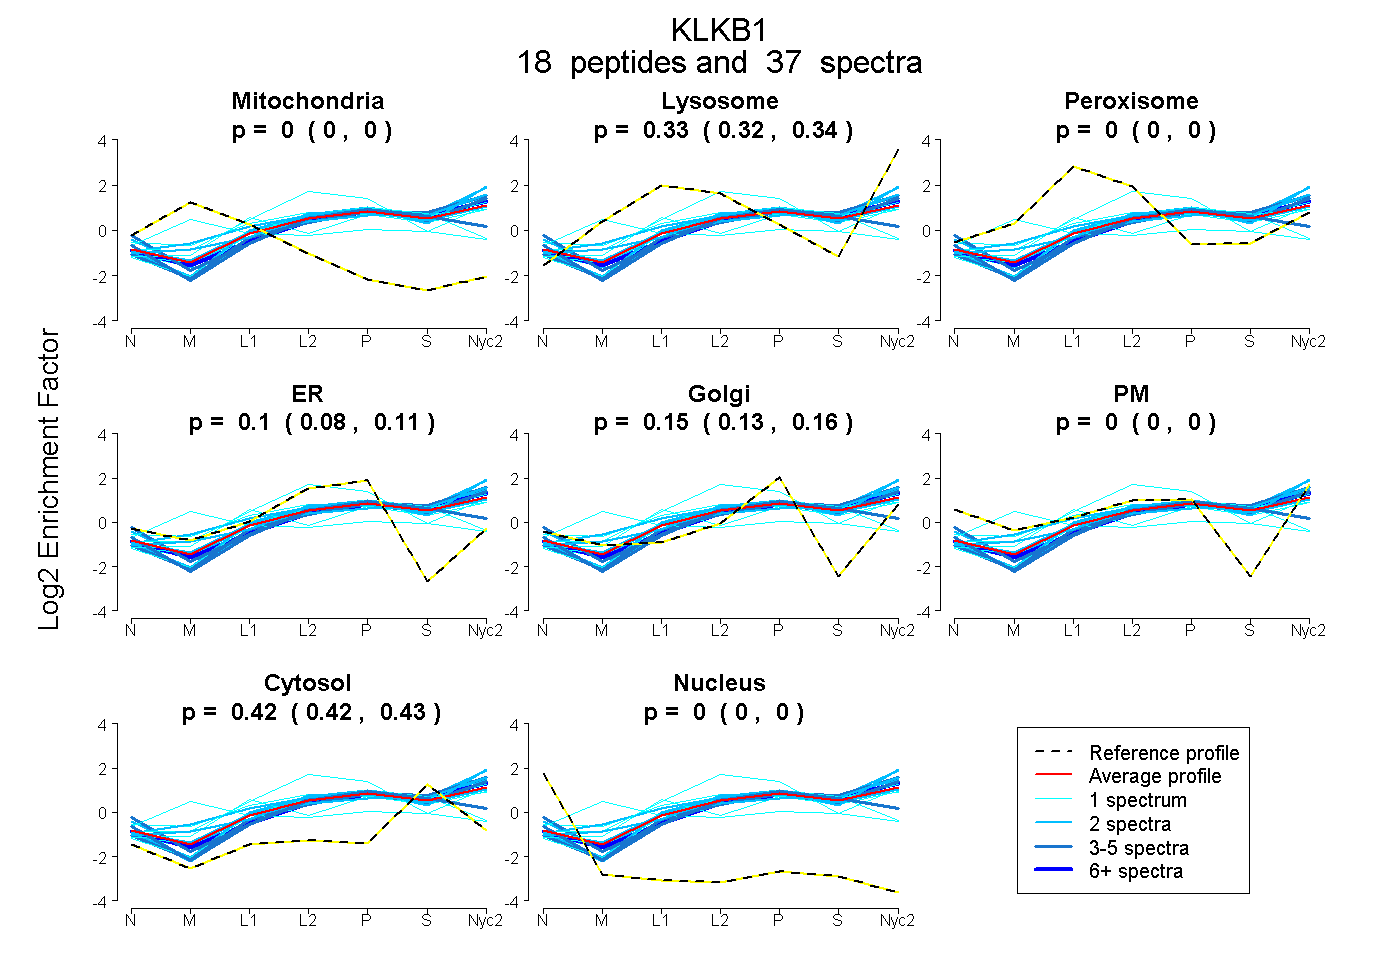
0.000 | 0.000
0.322 | 0.337
0.000 | 0.000
0.079 | 0.112
0.133 | 0.162
0.000 | 0.000
0.419 | 0.428
0.000 | 0.000
4peptides
spectra
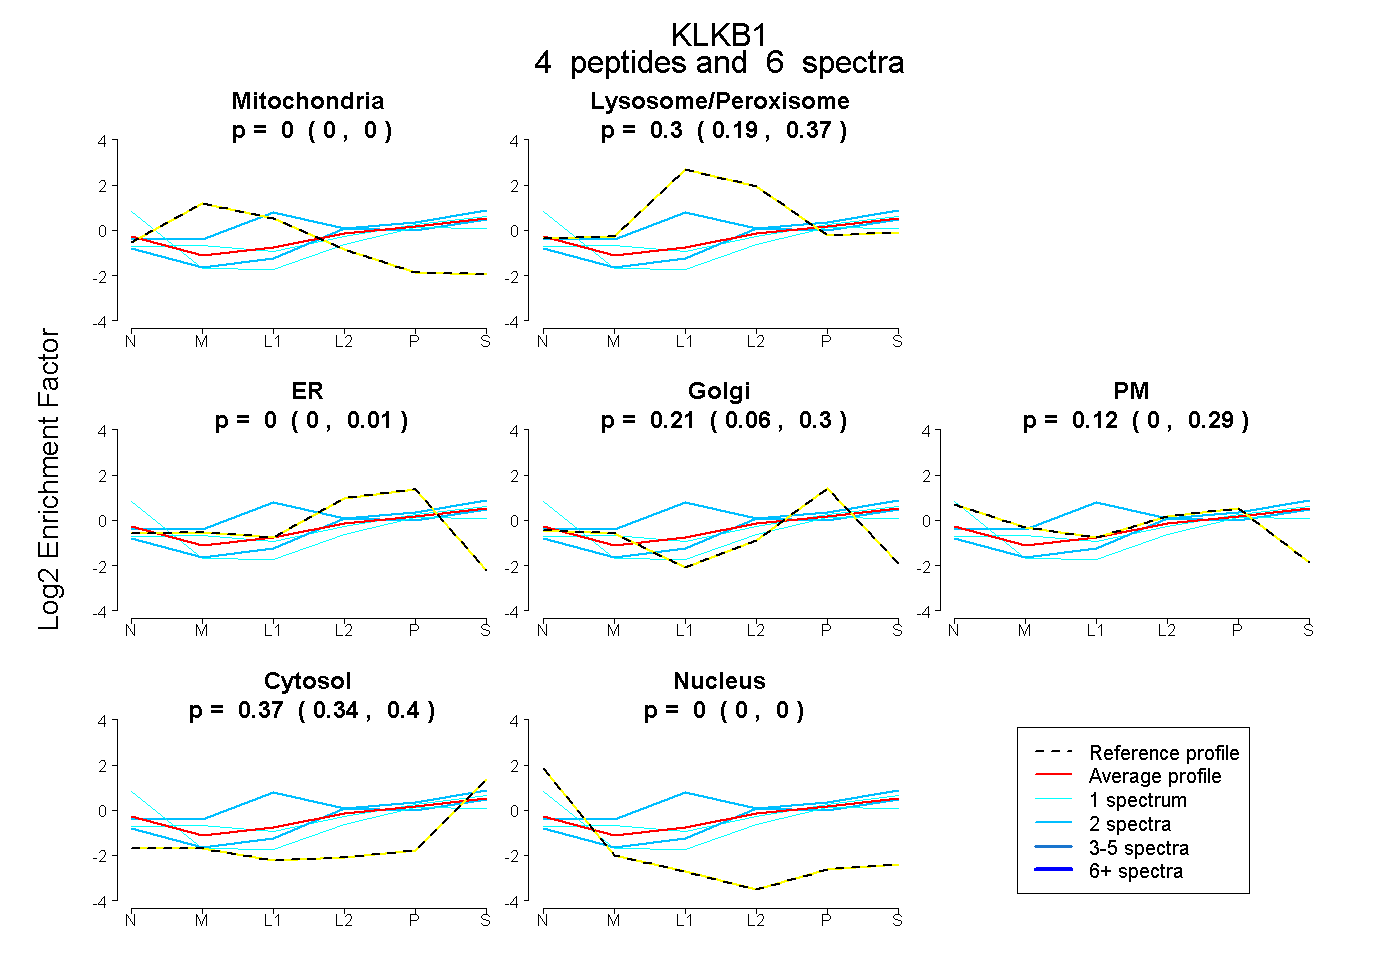
0.000 | 0.000
0.187 | 0.373
0.000 | 0.008
0.064 | 0.298
0.000 | 0.294
0.336 | 0.400
0.000 | 0.000
23peptides
spectra

0.000 | 0.000
1.000 | 1.000
3peptides
spectra
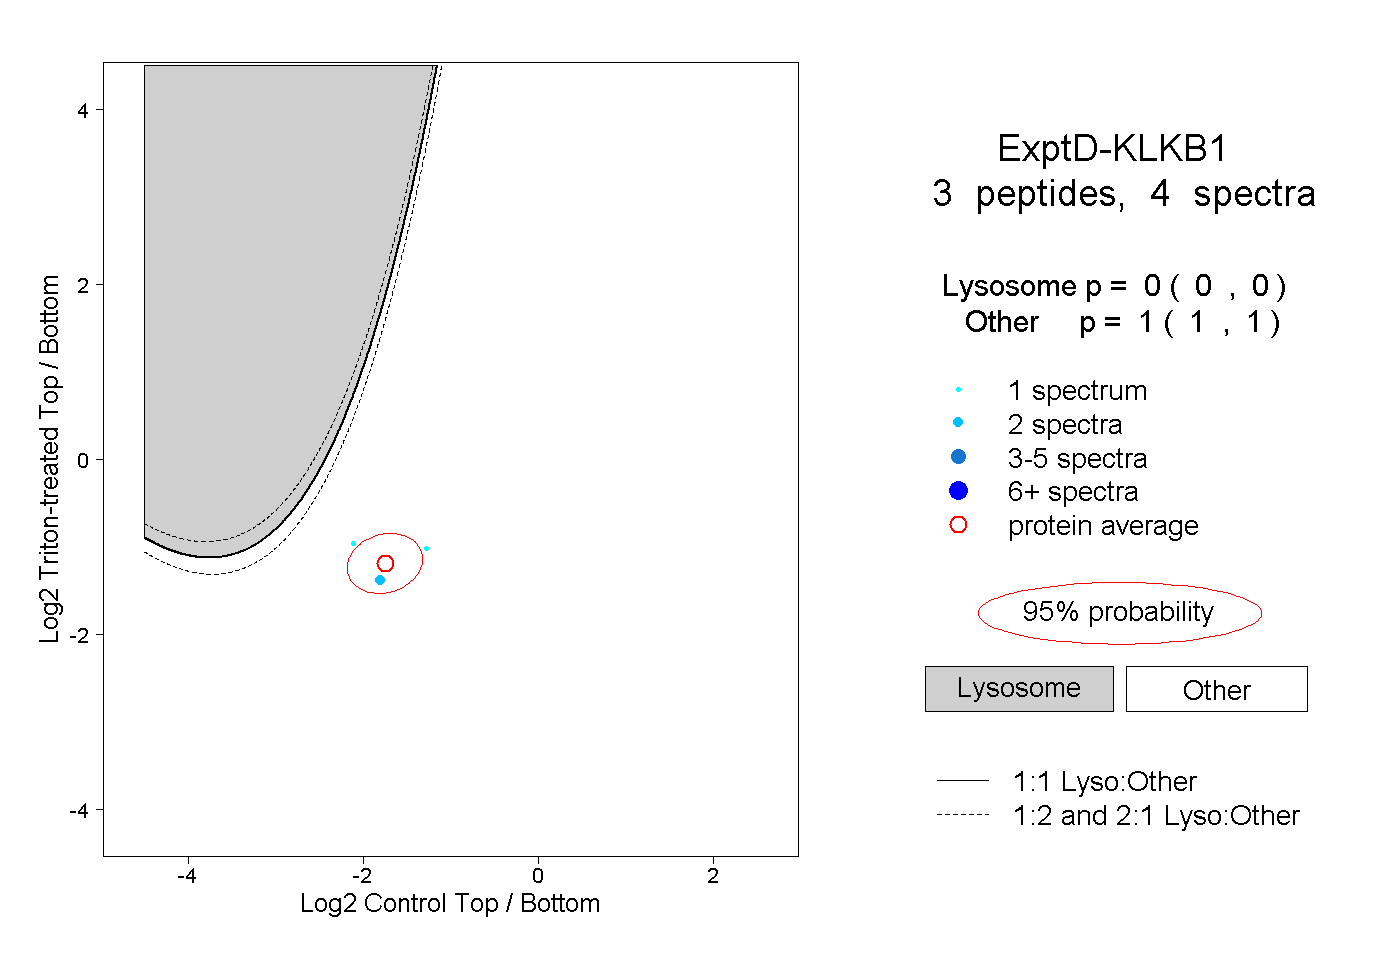
0.000 | 0.000
1.000 | 1.000