 5
5peptides
spectra
0.000 | 0.000
0.000 | 0.000
0.069 | 0.163
0.107 | 0.373
0.360 | 0.614
0.000 | 0.031
0.000 | 0.103
0.035 | 0.096
7peptides
spectra
0.000 | 0.000
1.000 | 1.000
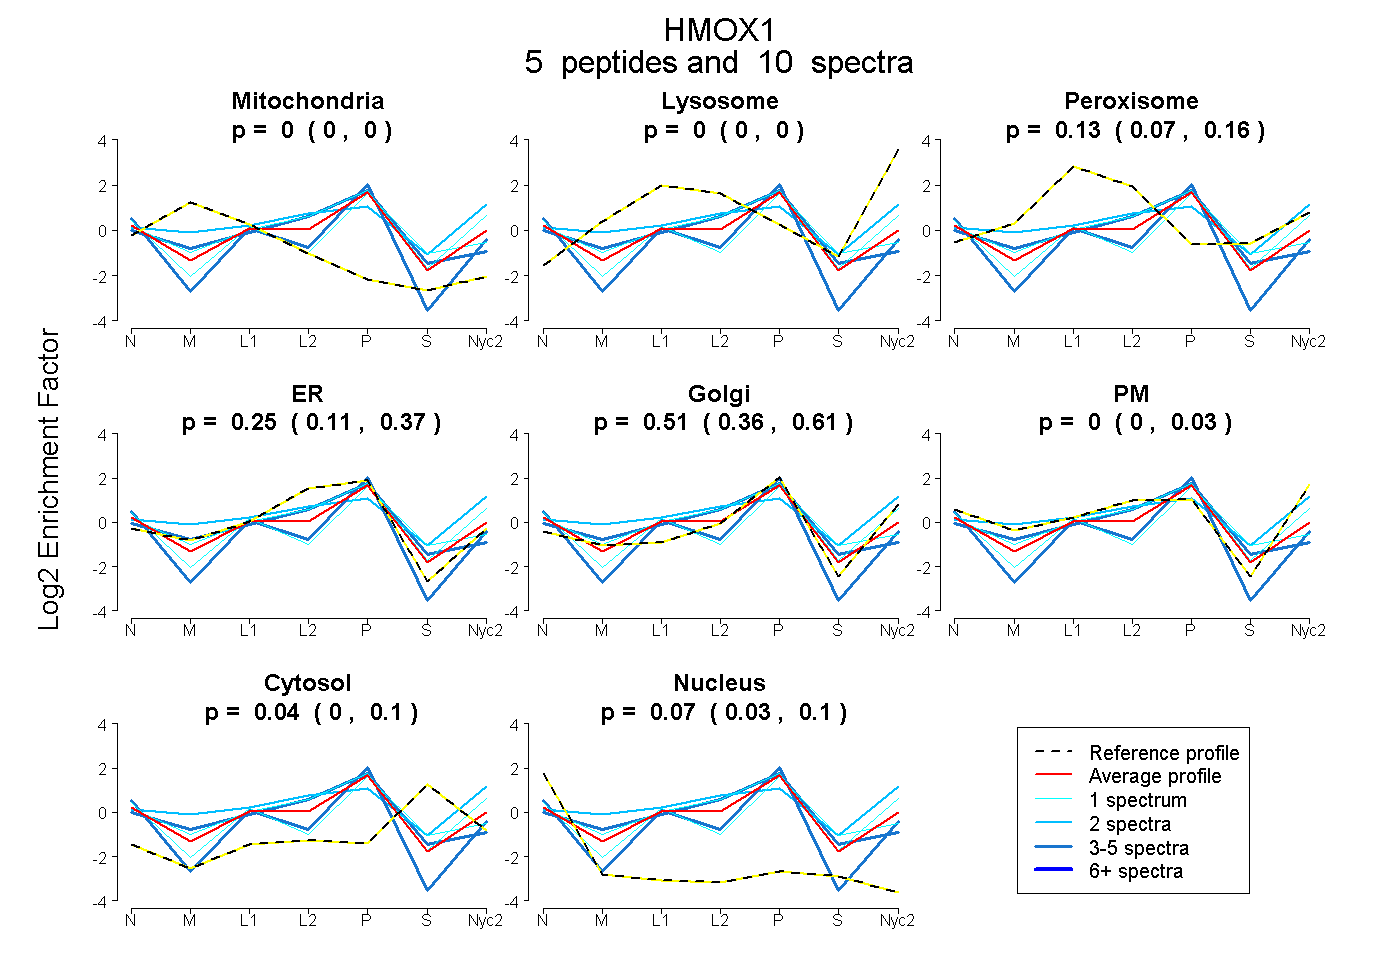
| Plot | Mito | Lyso | Perox | ER | Golgi | PM | Cytosol | Nucleus | |||||
| Expt A |
5 peptides |
10 spectra |
|
0.000 0.000 | 0.000 |
0.000 0.000 | 0.000 |
0.126 0.069 | 0.163 |
0.246 0.107 | 0.373 |
0.515 0.360 | 0.614 |
0.000 0.000 | 0.031 |
0.041 0.000 | 0.103 |
0.072 0.035 | 0.096 |
||
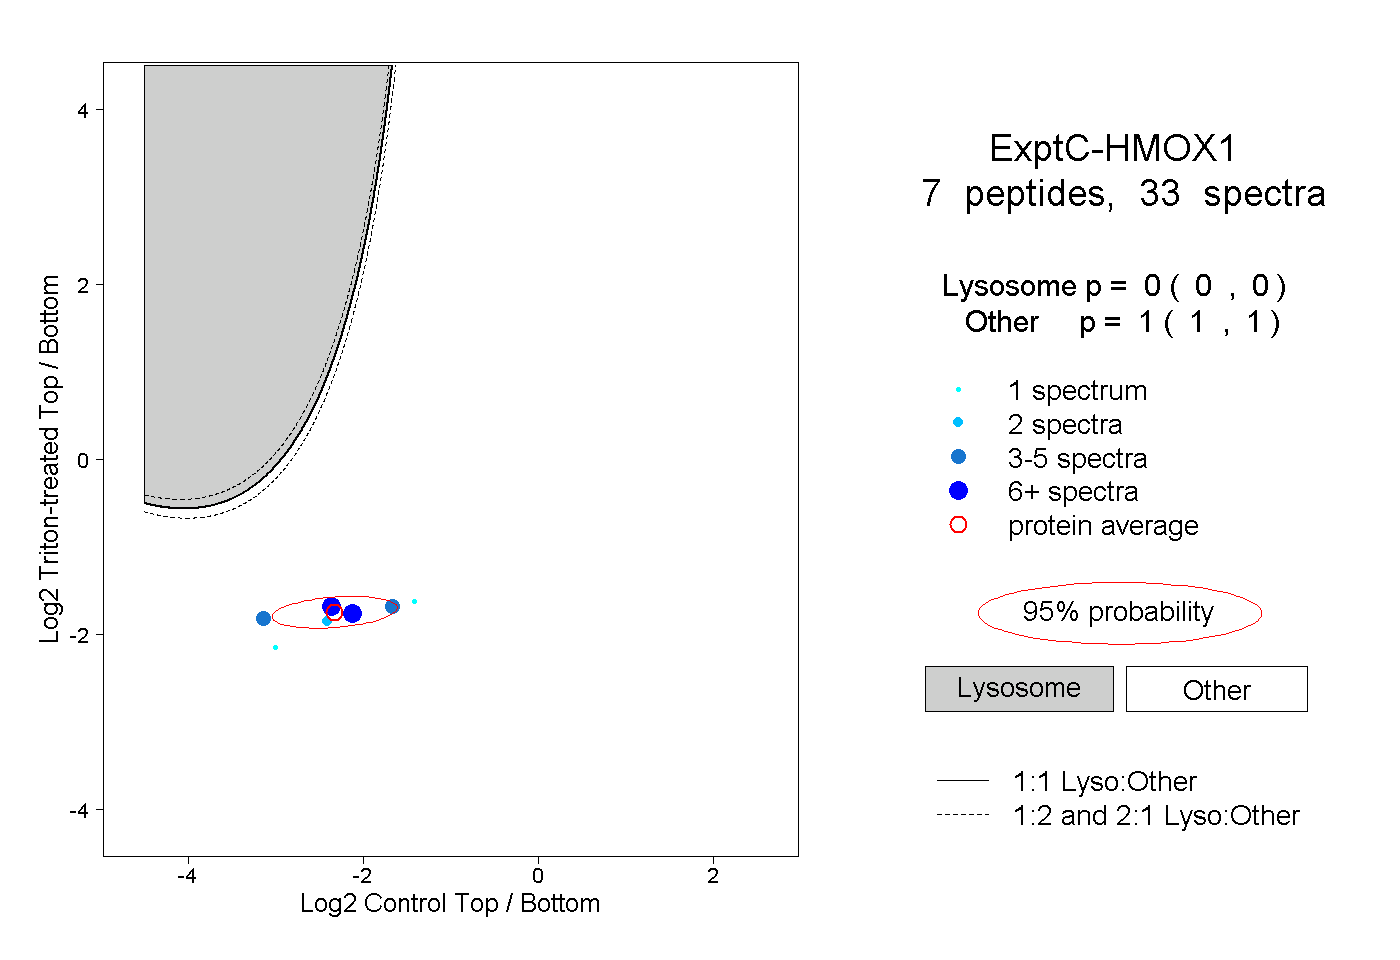
| Plot | Lyso | Other | |||||||||||
| Expt C |
7 peptides |
33 spectra |
|
0.000 0.000 | 0.000 |
1.000 1.000 | 1.000 |
| 1 spectrum, QRPASLVQDTTSAETPR | 0.000 | 1.000 | ||||||||
| 5 spectra, QNPVYAPLYFPEELHR | 0.000 | 1.000 | ||||||||
| 4 spectra, YLGDLSGGQVLK | 0.000 | 1.000 | ||||||||
| 2 spectra, DQSPSQTEFLR | 0.000 | 1.000 | ||||||||
| 1 spectrum, MNTLEMTPEVK | 0.000 | 1.000 | ||||||||
| 11 spectra, VTEEAK | 0.000 | 1.000 | ||||||||
| 9 spectra, AENSEFMR | 0.000 | 1.000 |