 7
7peptides
spectra
0.000 | 0.000
0.000 | 0.000
0.000 | 0.000
0.549 | 0.608
0.314 | 0.397
0.000 | 0.029
0.017 | 0.075
0.000 | 0.004
| Plot | Mito | Lyso | Perox | ER | Golgi | PM | Cytosol | Nucleus | |||||
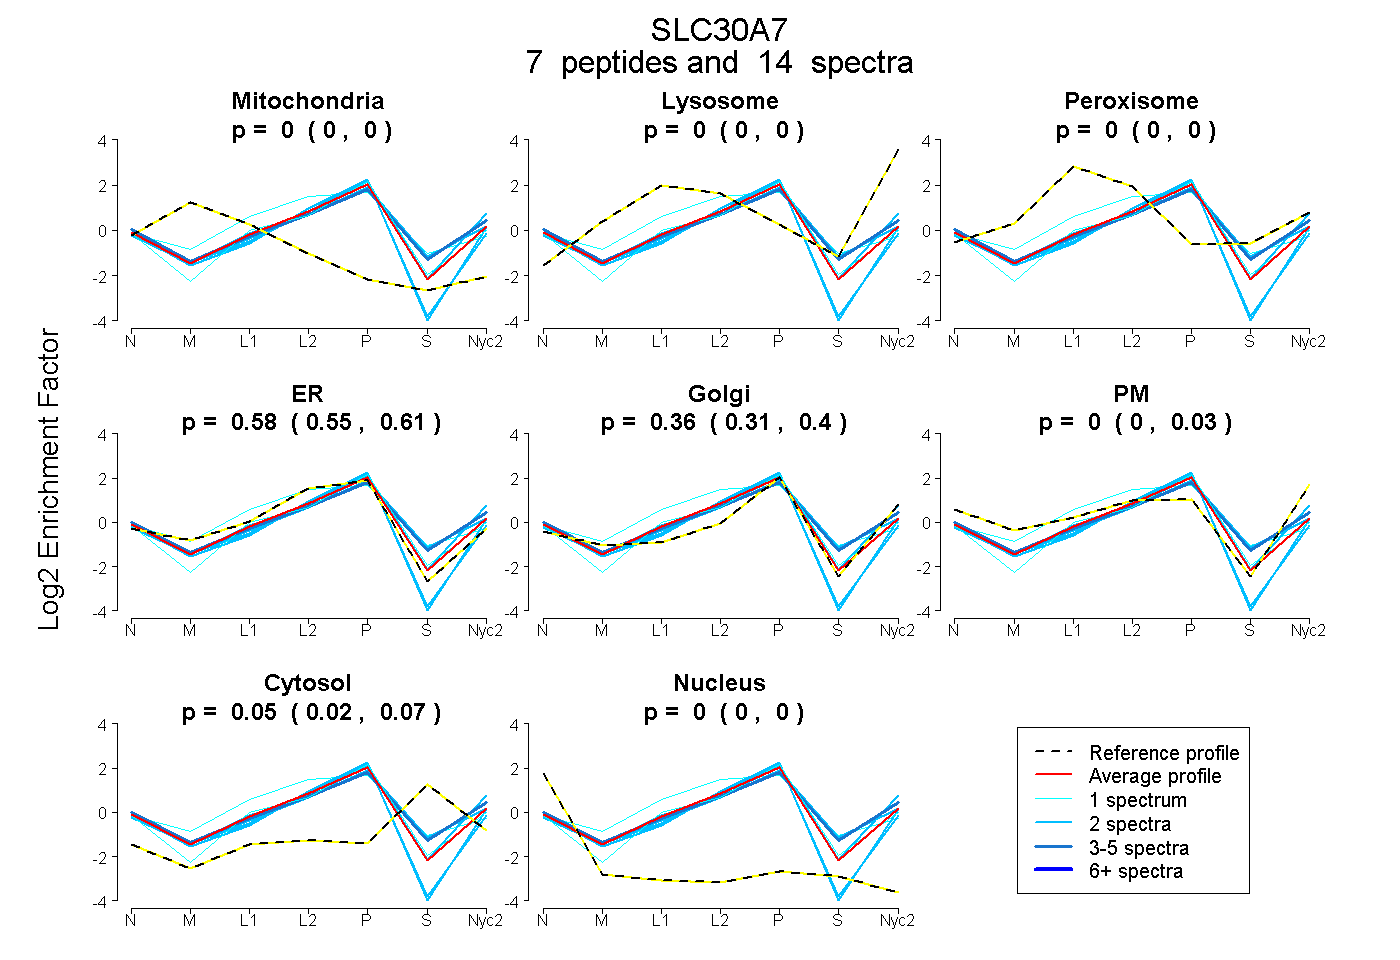
| Expt A |
7 peptides |
14 spectra |
|
0.000 0.000 | 0.000 |
0.000 0.000 | 0.000 |
0.000 0.000 | 0.000 |
0.581 0.549 | 0.608 |
0.363 0.314 | 0.397 |
0.005 0.000 | 0.029 |
0.051 0.017 | 0.075 |
0.000 0.000 | 0.004 |
| 4 spectra, LVVAPDADAR | 0.000 | 0.000 | 0.015 | 0.356 | 0.294 | 0.178 | 0.157 | 0.000 | ||
| 1 spectrum, ALAPPDVHHER | 0.000 | 0.000 | 0.212 | 0.676 | 0.000 | 0.000 | 0.111 | 0.000 | ||
| 2 spectra, ESIGILMQR | 0.000 | 0.060 | 0.000 | 0.336 | 0.575 | 0.016 | 0.013 | 0.000 | ||
| 2 spectra, DDEYKPPK | 0.000 | 0.000 | 0.026 | 0.436 | 0.351 | 0.013 | 0.174 | 0.000 | ||
| 1 spectrum, TPPSLENVLPQCYQR | 0.000 | 0.000 | 0.000 | 0.564 | 0.322 | 0.000 | 0.114 | 0.000 | ||
| 2 spectra, ISGWFR | 0.000 | 0.000 | 0.000 | 0.610 | 0.366 | 0.000 | 0.000 | 0.023 | ||
| 2 spectra, FNLFGK | 0.000 | 0.000 | 0.000 | 0.653 | 0.303 | 0.000 | 0.000 | 0.044 |
| Plot | Mito | Lyso or Perox | ER | Golgi | PM | Cytosol | Nucleus | ||||||
| Expt B |
4 peptides |
9 spectra |
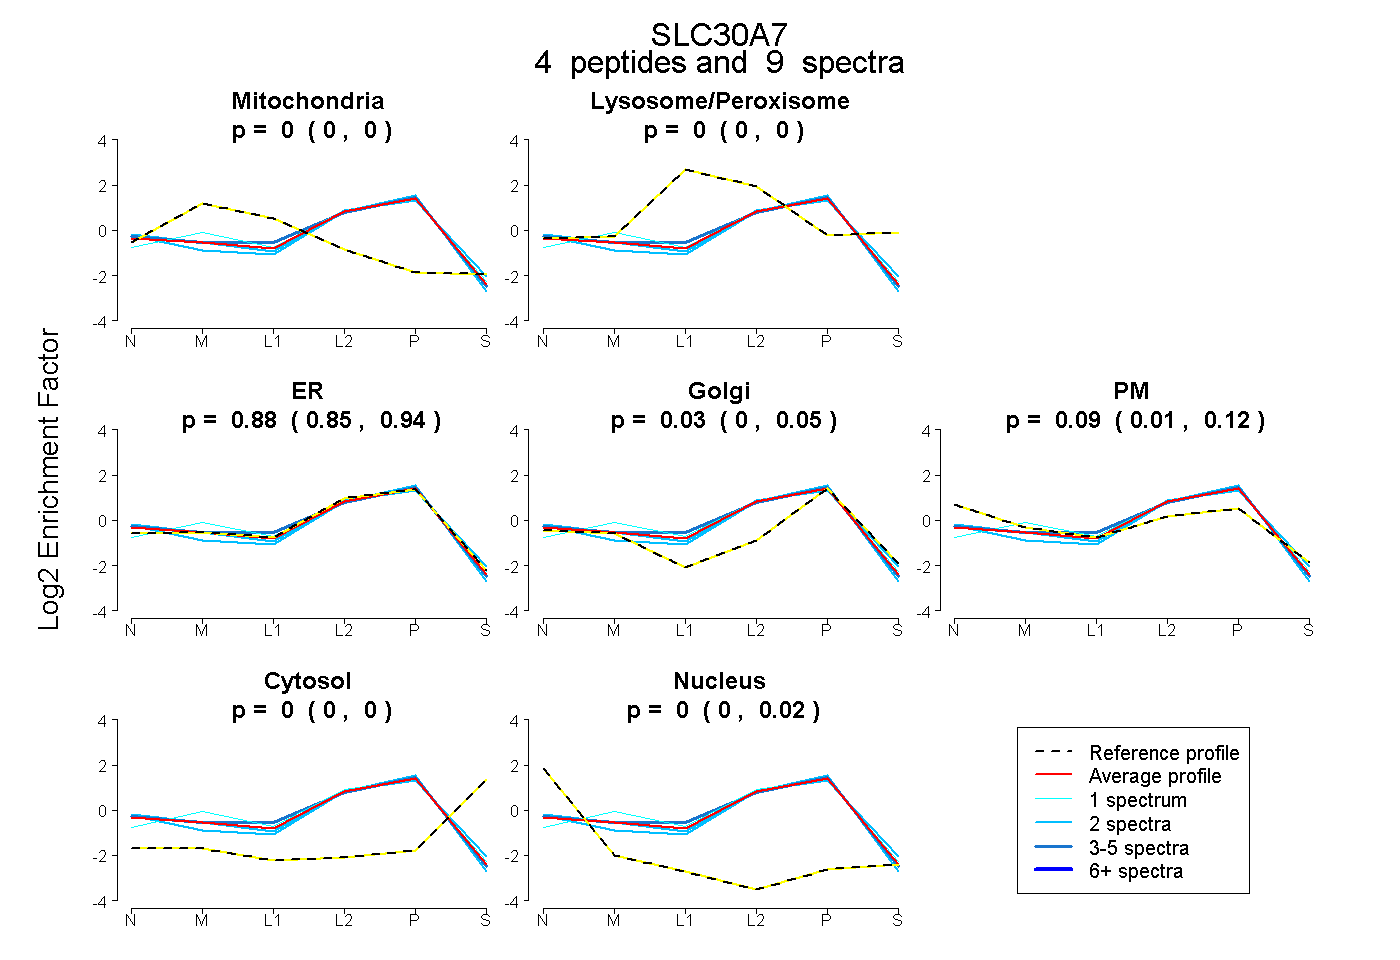 |
0.000 0.000 | 0.000 |
0.000 0.000 | 0.000 |
0.880 0.849 | 0.936 |
0.032 0.000 | 0.054 |
0.088 0.015 | 0.122 |
0.000 0.000 | 0.000 |
0.000 0.000 | 0.015 |
|||
| Plot | Lyso | Other | |||||||||||
| Expt C |
7 peptides |
16 spectra |
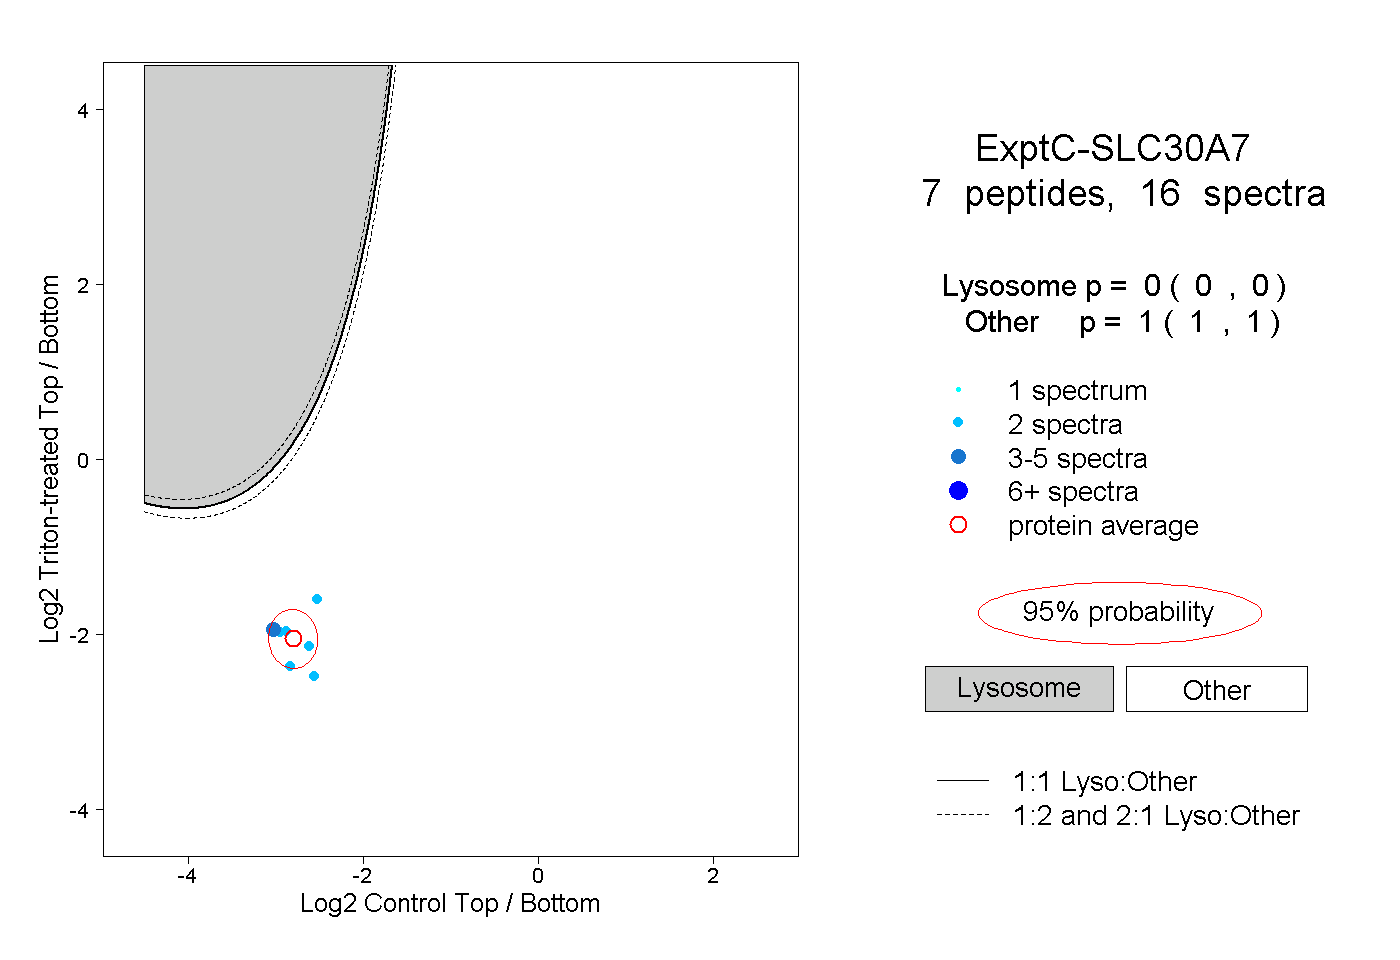 |
0.000 0.000 | 0.000 |
1.000 1.000 | 1.000 |
||||||||
| Plot | Lyso | Other | |||||||||||
| Expt D |
3 peptides |
6 spectra |
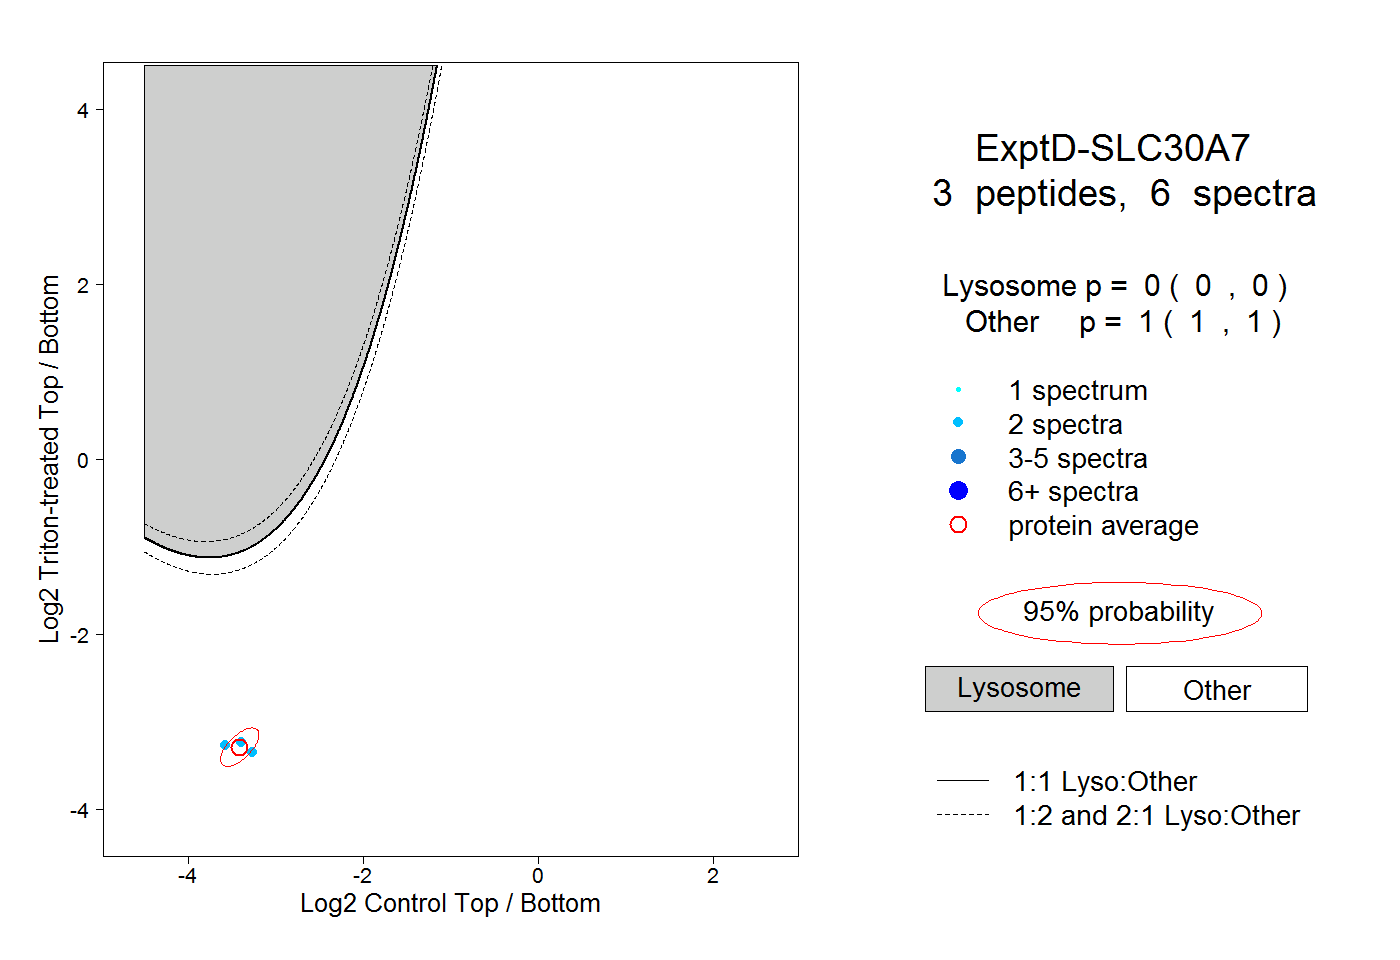 |
0.000 0.000 | 0.000 |
1.000 1.000 | 1.000 |