 3
3peptides
spectra
0.000 | 0.000
0.005 | 0.152
0.000 | 0.206
0.000 | 0.078
0.000 | 0.000
0.410 | 0.615
0.179 | 0.329
0.000 | 0.000
2peptides
spectra
0.000 | 0.000
1.000 | 1.000
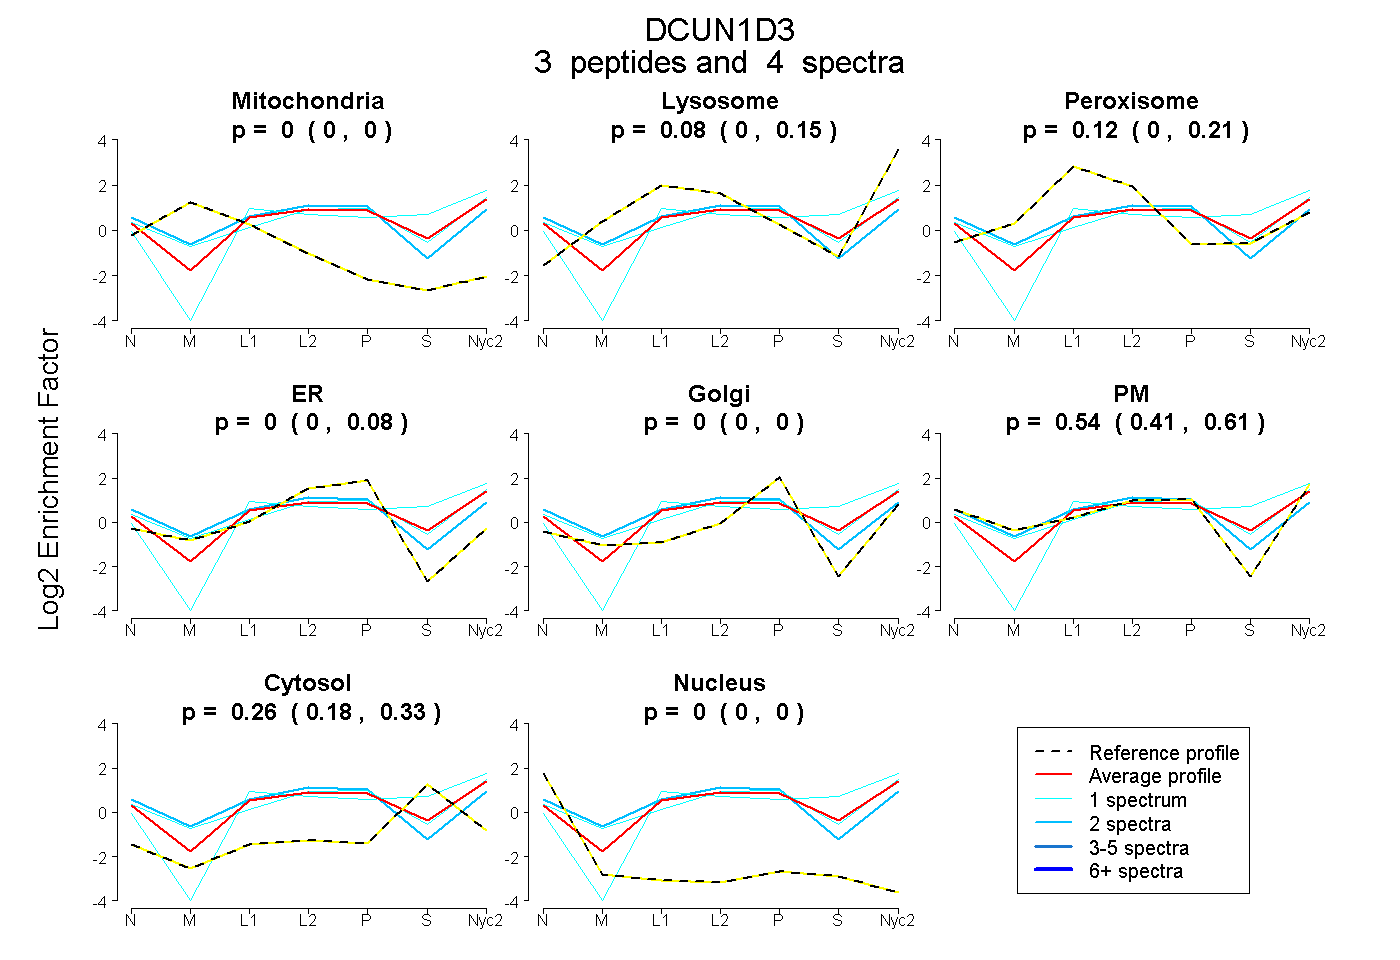
| Plot | Mito | Lyso | Perox | ER | Golgi | PM | Cytosol | Nucleus | |||||
| Expt A |
3 peptides |
4 spectra |
|
0.000 0.000 | 0.000 |
0.078 0.005 | 0.152 |
0.116 0.000 | 0.206 |
0.000 0.000 | 0.078 |
0.000 0.000 | 0.000 |
0.541 0.410 | 0.615 |
0.264 0.179 | 0.329 |
0.000 0.000 | 0.000 |
||
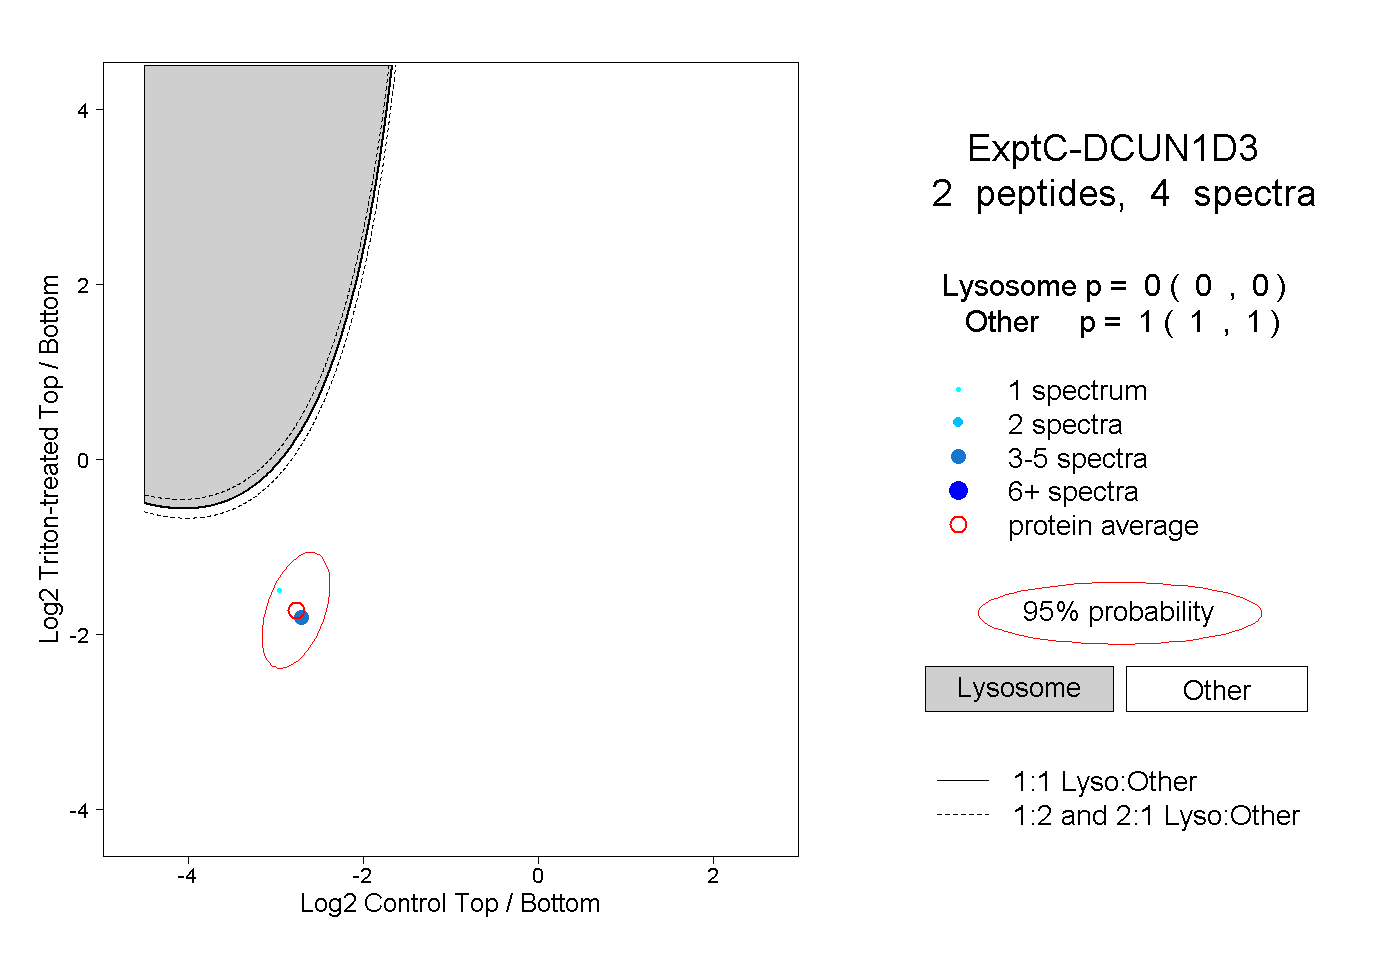
| Plot | Lyso | Other | |||||||||||
| Expt C |
2 peptides |
4 spectra |
|
0.000 0.000 | 0.000 |
1.000 1.000 | 1.000 |