 13
13peptides
spectra
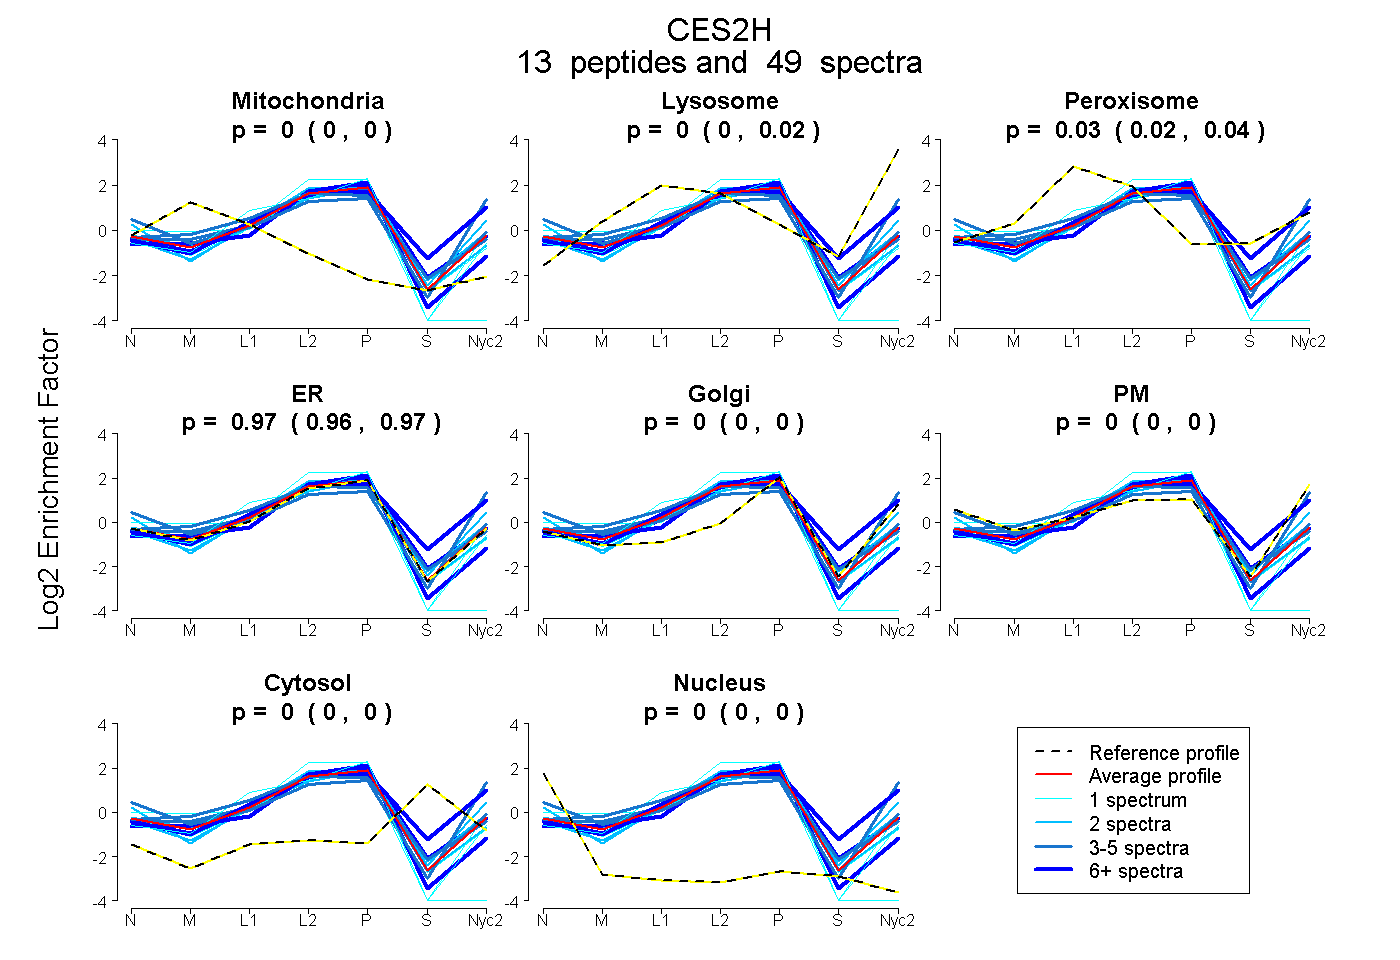
0.000 | 0.000
0.000 | 0.016
0.017 | 0.040
0.956 | 0.974
0.000 | 0.000
0.000 | 0.000
0.000 | 0.000
0.000 | 0.000
3peptides
spectra
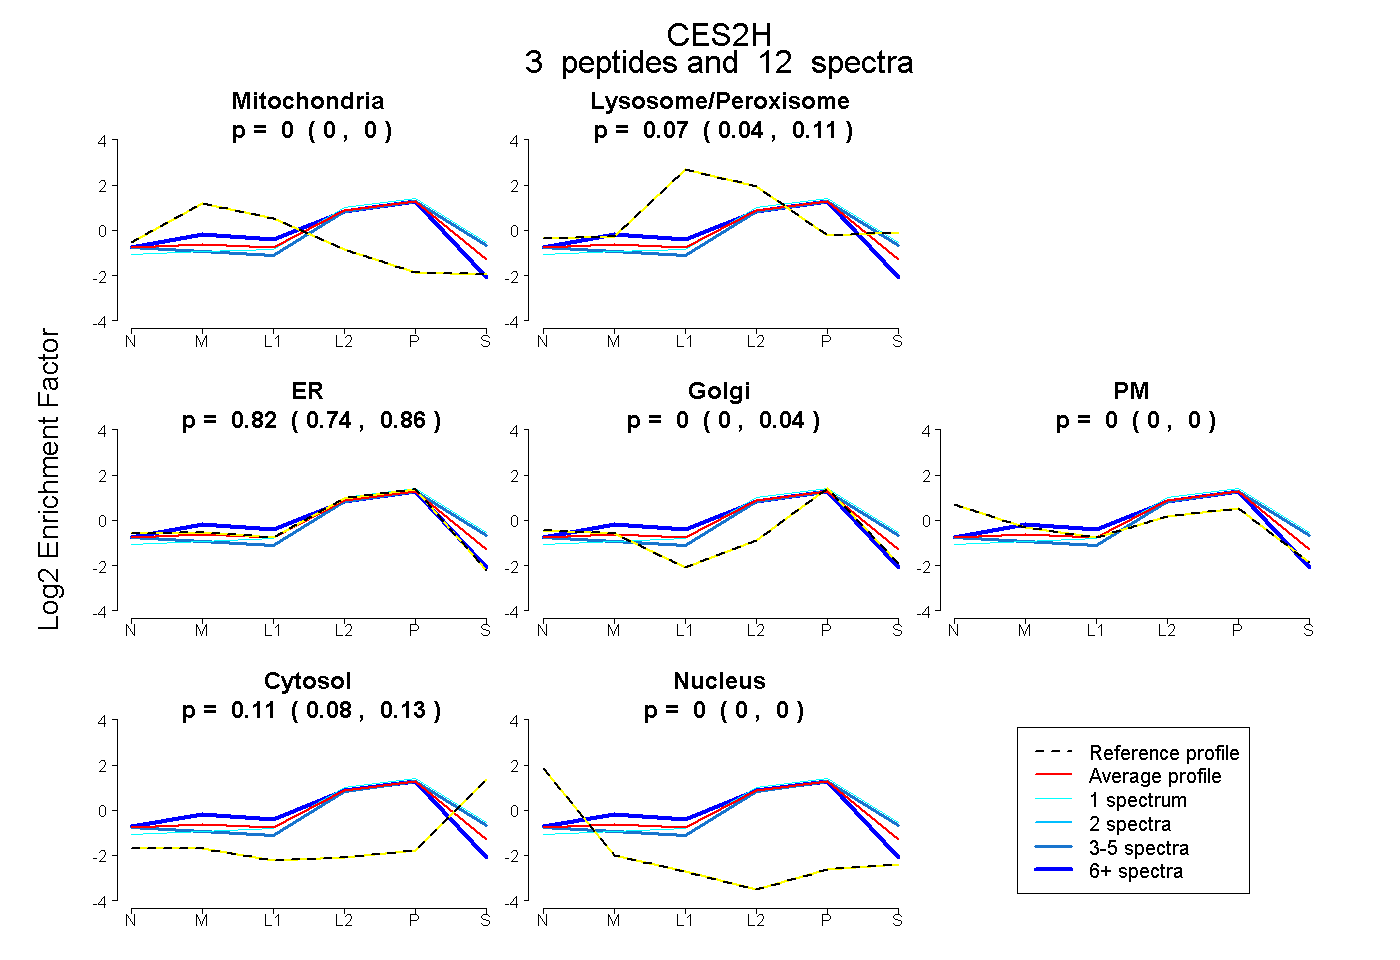
0.000 | 0.000
0.041 | 0.110
0.739 | 0.858
0.000 | 0.036
0.000 | 0.000
0.076 | 0.132
0.000 | 0.000
9peptides
spectra
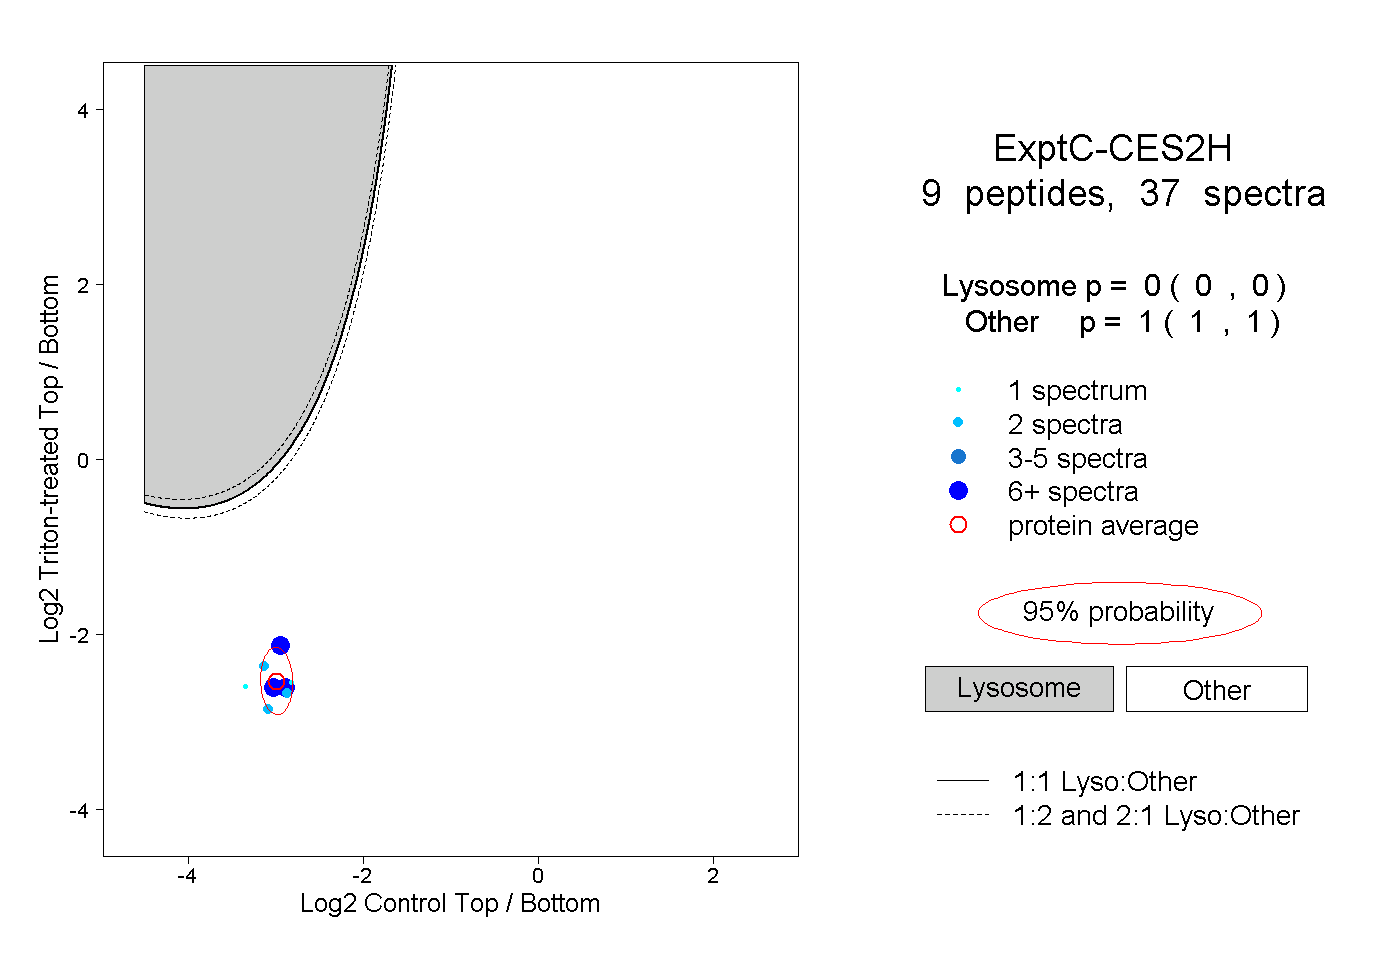
0.000 | 0.000
1.000 | 1.000
2peptides
spectra
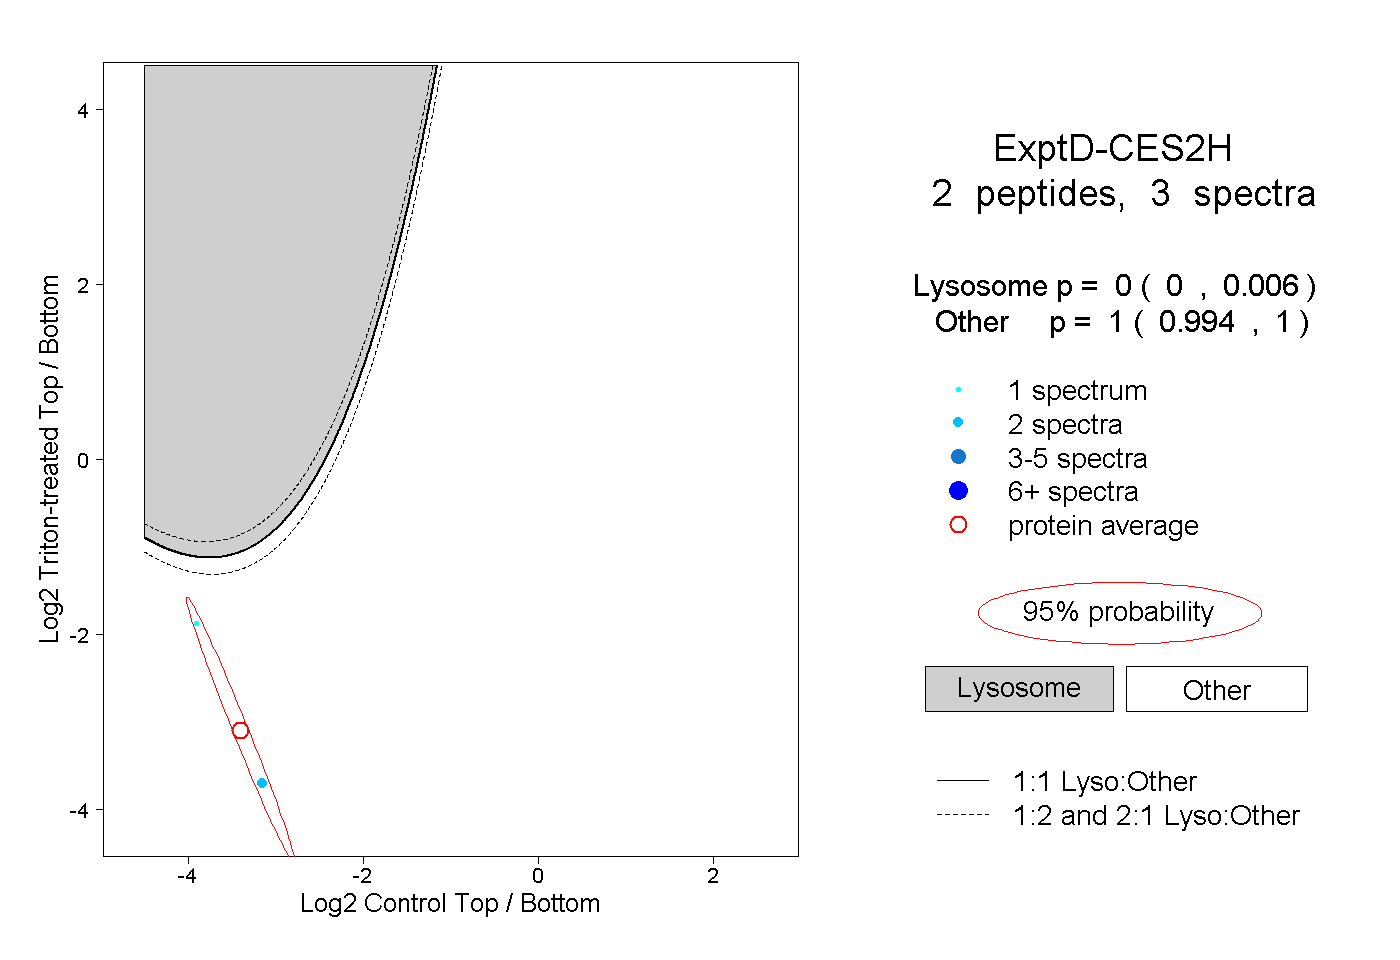
0.000 | 0.006
0.994 | 1.000