 1
1peptide
spectra
0.000 | 0.254
0.000 | 0.000
0.000 | 0.000
0.000 | 0.296
0.019 | 0.424
0.025 | 0.400
0.050 | 0.217
0.048 | 0.239
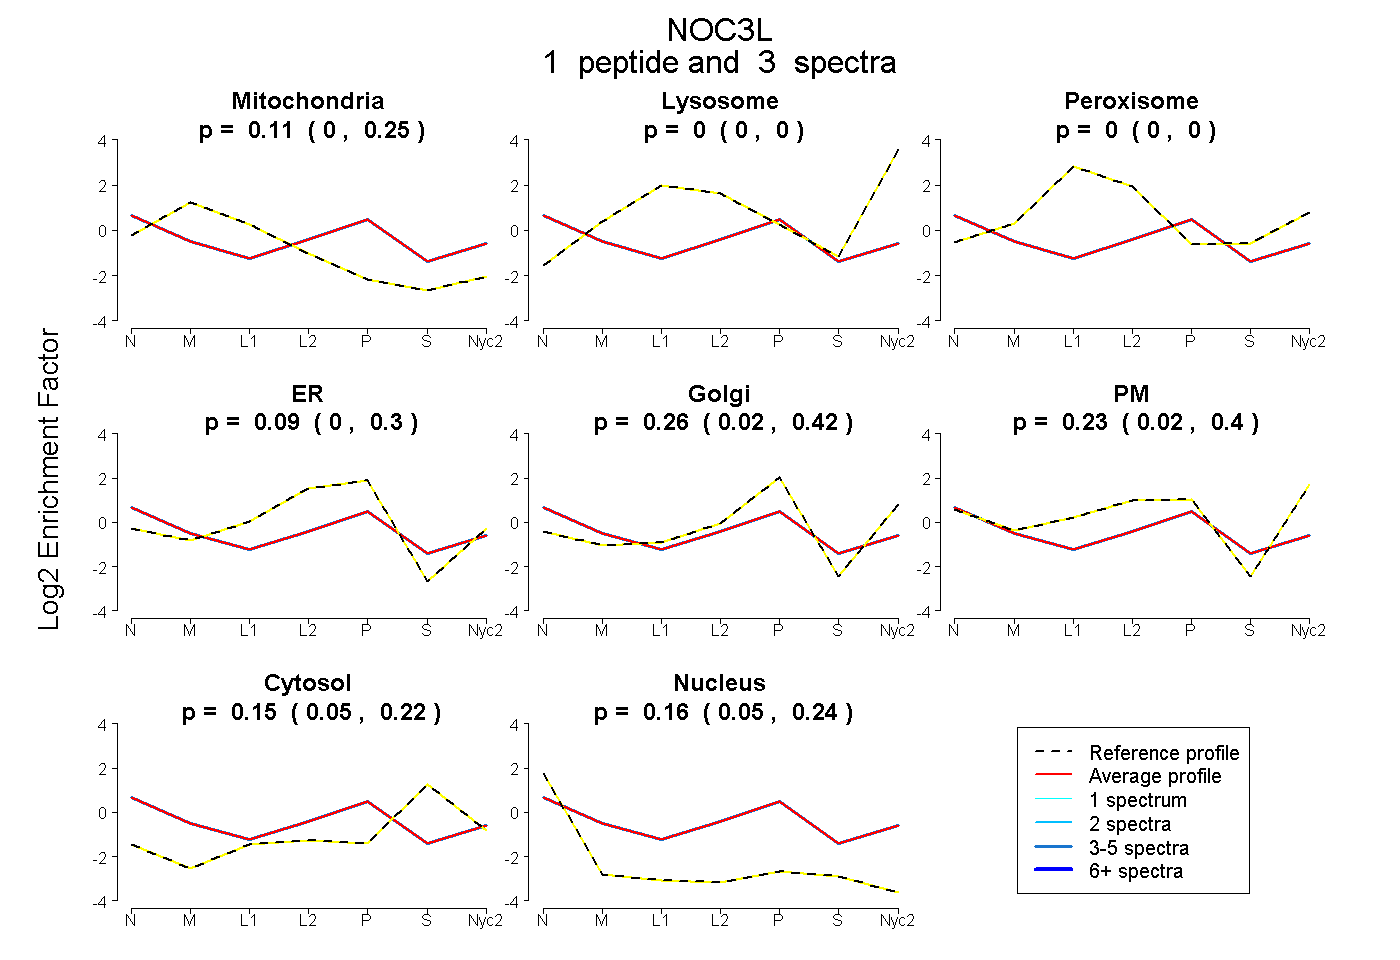
| Plot | Mito | Lyso | Perox | ER | Golgi | PM | Cytosol | Nucleus | |||||
| Expt A |
1 peptide |
3 spectra |
|
0.111 0.000 | 0.254 |
0.000 0.000 | 0.000 |
0.000 0.000 | 0.000 |
0.094 0.000 | 0.296 |
0.256 0.019 | 0.424 |
0.234 0.025 | 0.400 |
0.146 0.050 | 0.217 |
0.158 0.048 | 0.239 |