 2
2peptides
spectra
0.000 | 0.000
0.000 | 0.117
0.000 | 0.000
0.000 | 0.001
0.652 | 0.776
0.111 | 0.326
0.000 | 0.052
0.000 | 0.000
1peptide
spectrum
NA | NA
NA | NA
| Plot | Mito | Lyso | Perox | ER | Golgi | PM | Cytosol | Nucleus | |||||
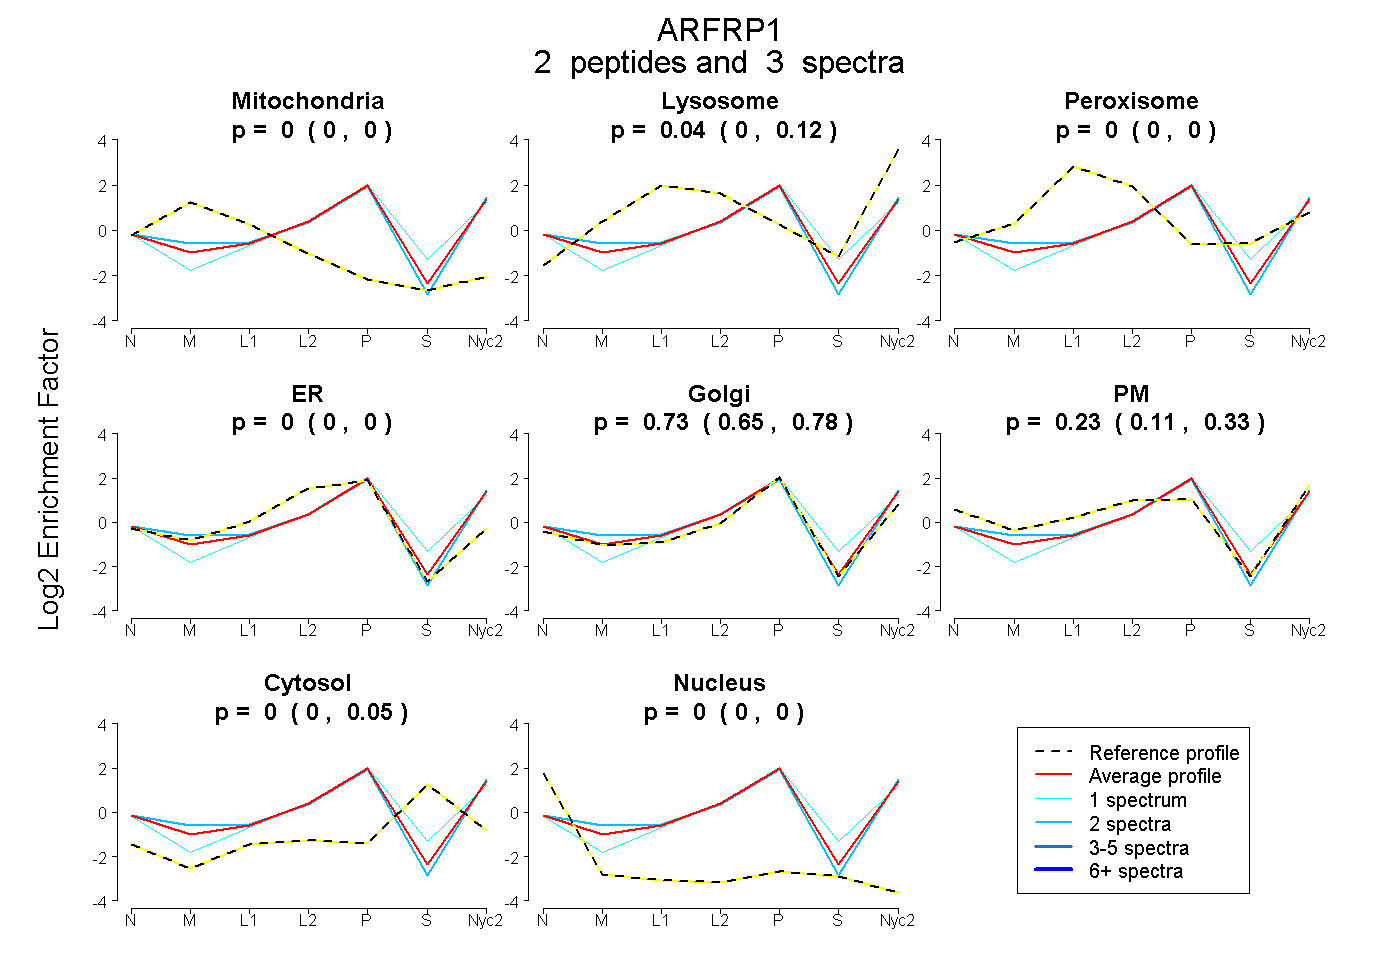
| Expt A |
2 peptides |
3 spectra |
|
0.000 0.000 | 0.000 |
0.044 0.000 | 0.117 |
0.000 0.000 | 0.000 |
0.000 0.000 | 0.001 |
0.731 0.652 | 0.776 |
0.225 0.111 | 0.326 |
0.000 0.000 | 0.052 |
0.000 0.000 | 0.000 |
||
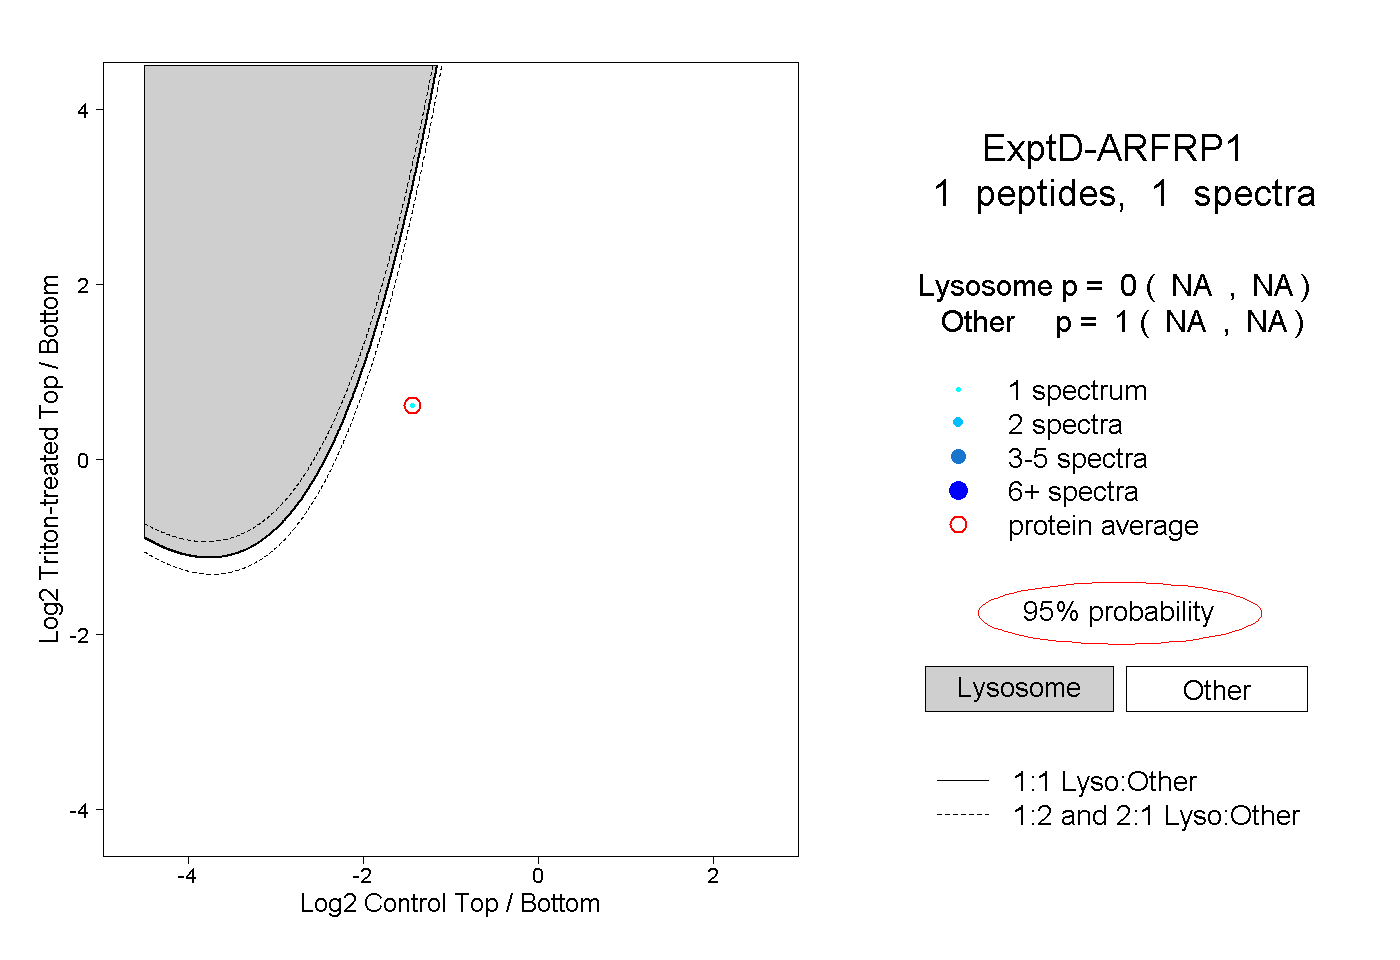
| Plot | Lyso | Other | |||||||||||
| Expt D |
1 peptide |
1 spectrum |
|
0.000 NA | NA |
1.000 NA | NA |