 14
14peptides
spectra
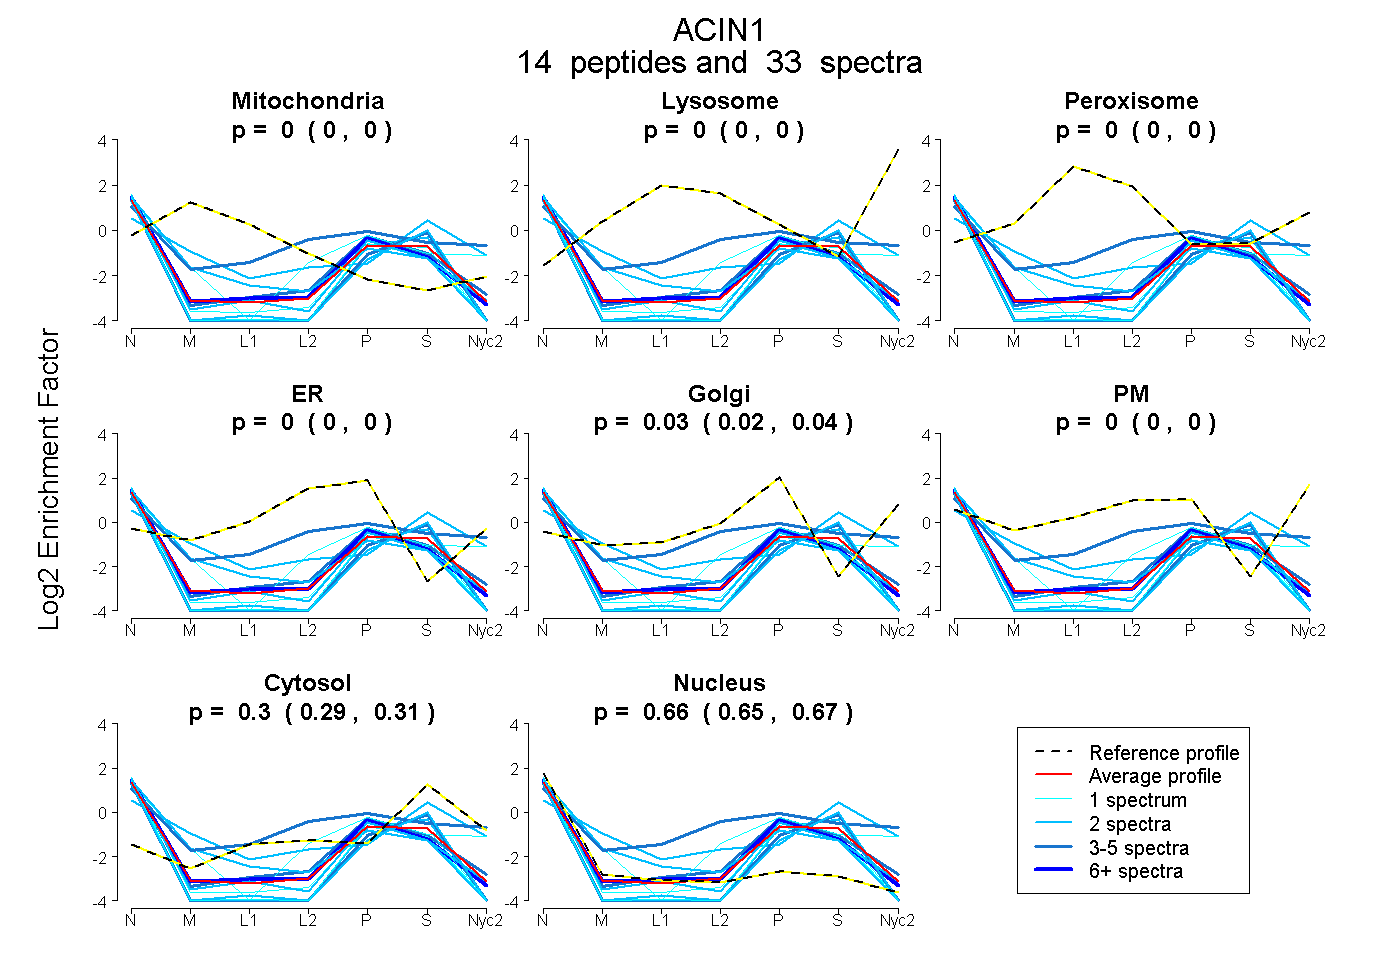
0.000 | 0.000
0.000 | 0.000
0.000 | 0.000
0.000 | 0.000
0.019 | 0.041
0.000 | 0.000
0.295 | 0.313
0.652 | 0.674
3peptides
spectra
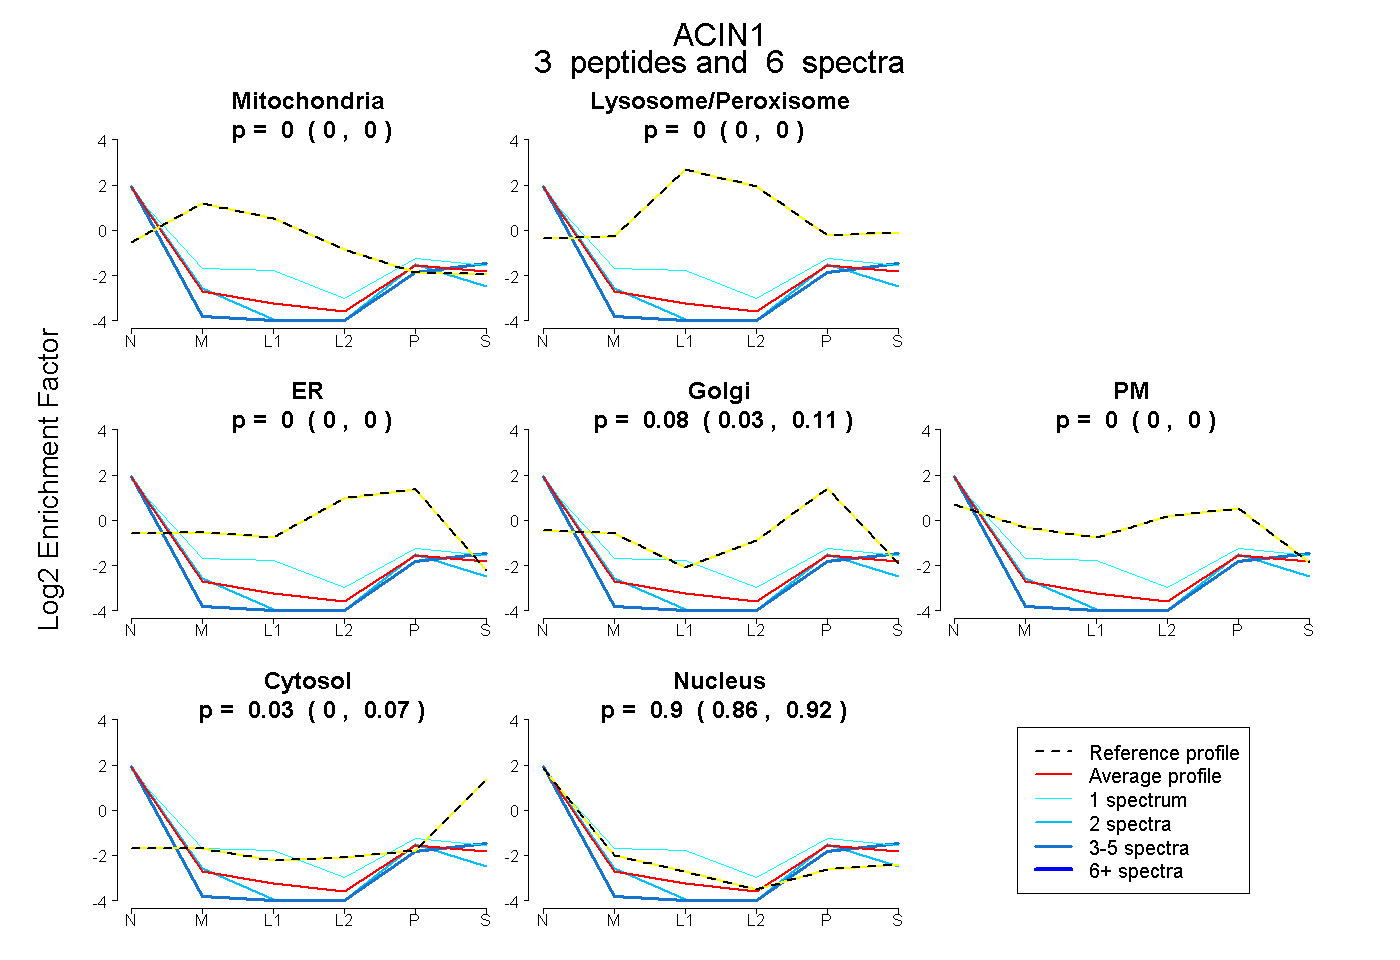
0.000 | 0.000
0.000 | 0.000
0.000 | 0.000
0.027 | 0.113
0.000 | 0.000
0.000 | 0.073
0.859 | 0.924
1peptide
spectra
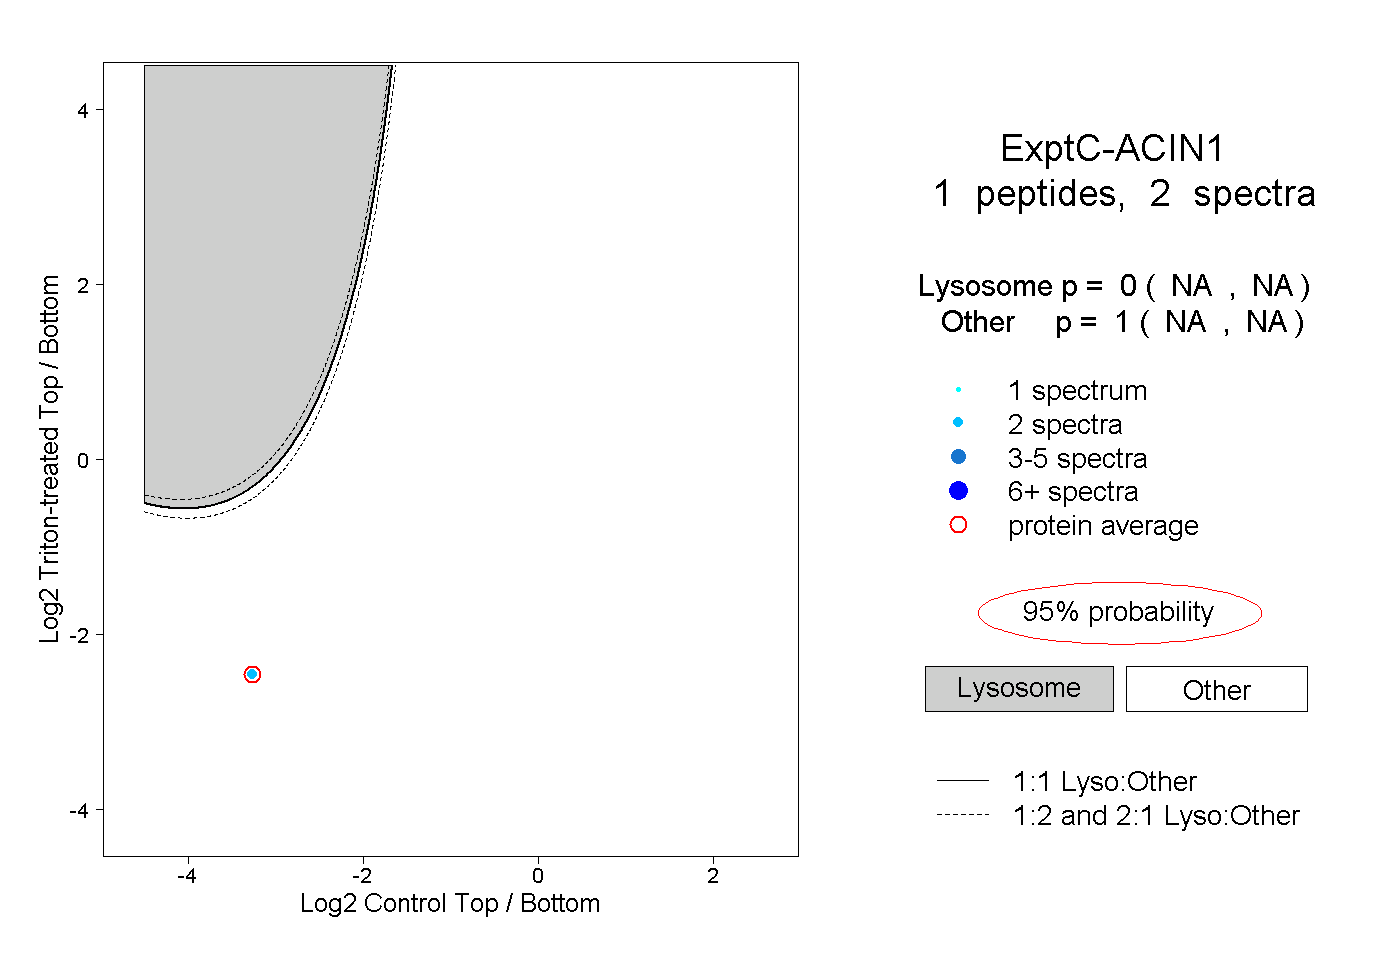
NA | NA
NA | NA
1peptide
spectra
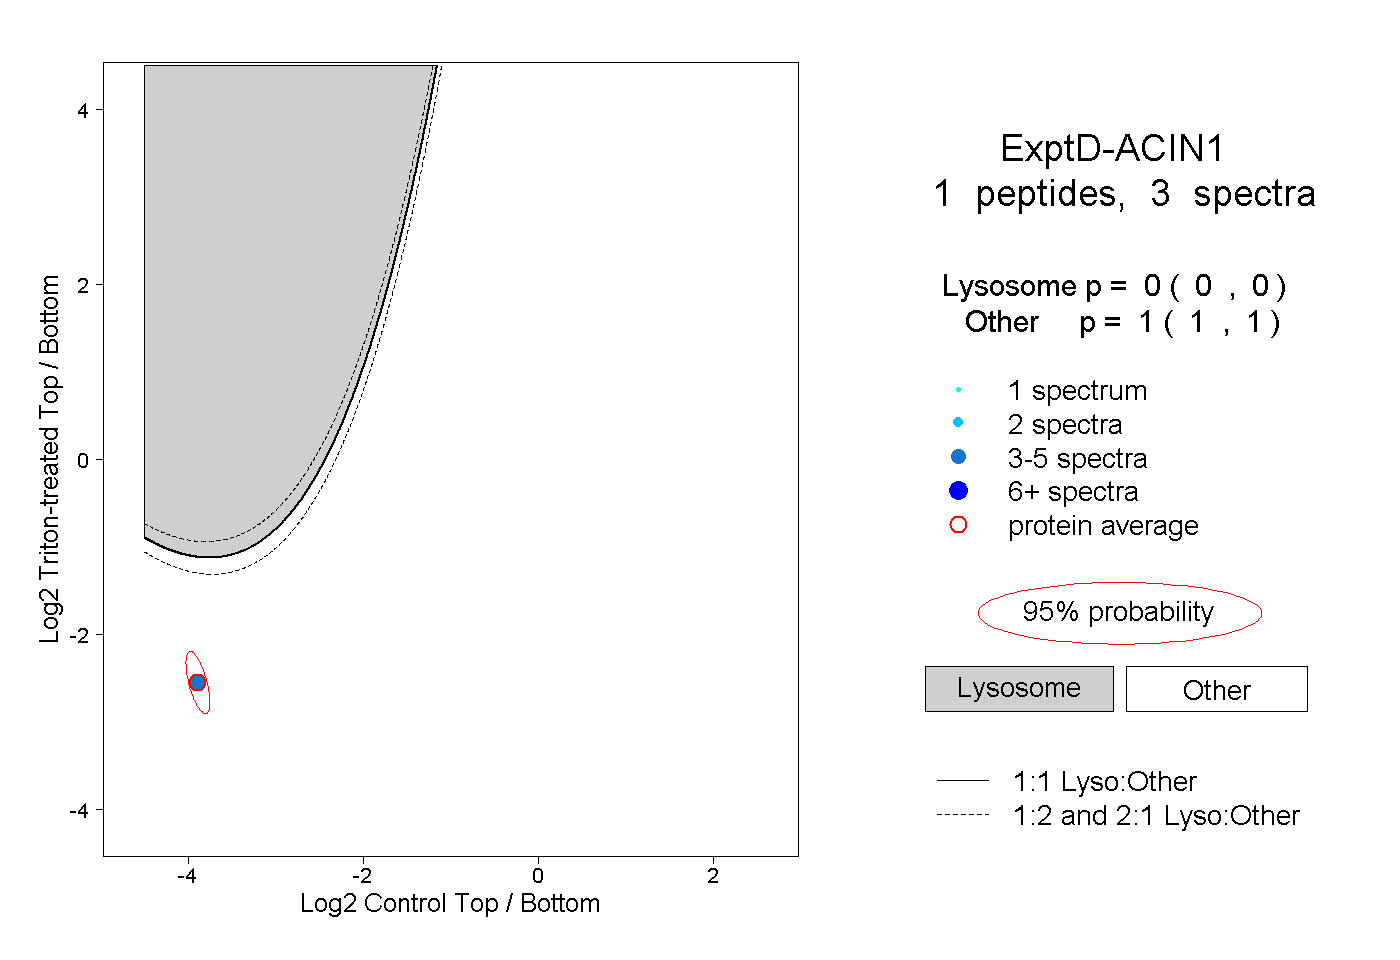
0.000 | 0.000
1.000 | 1.000