17
17peptides
spectra
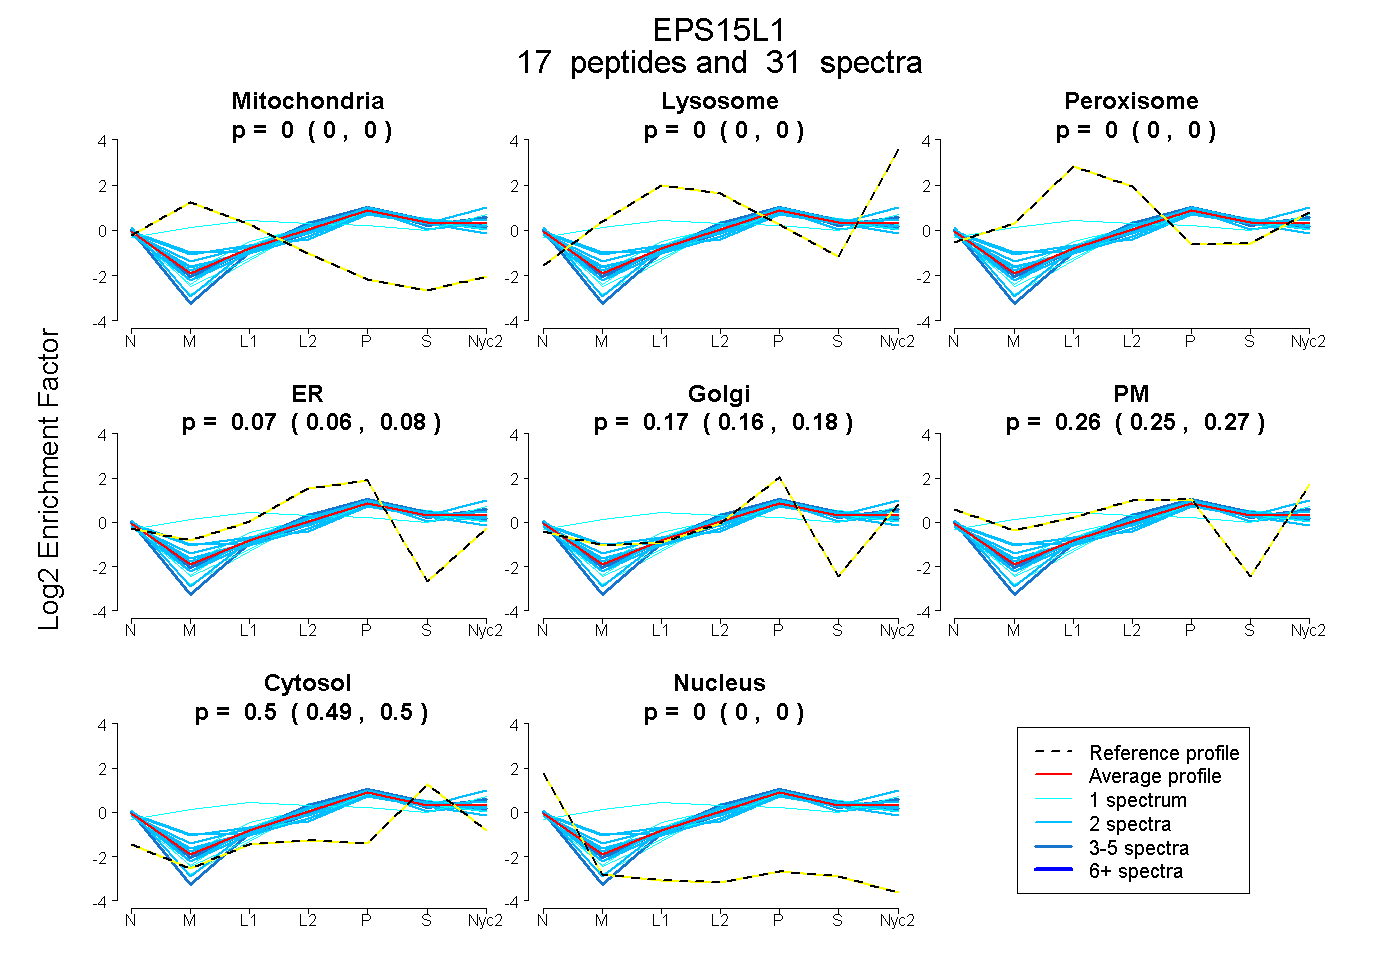
0.000 | 0.000
0.000 | 0.000
0.000 | 0.000
0.060 | 0.081
0.157 | 0.180
0.251 | 0.273
0.492 | 0.499
0.000 | 0.000
3peptides
spectra
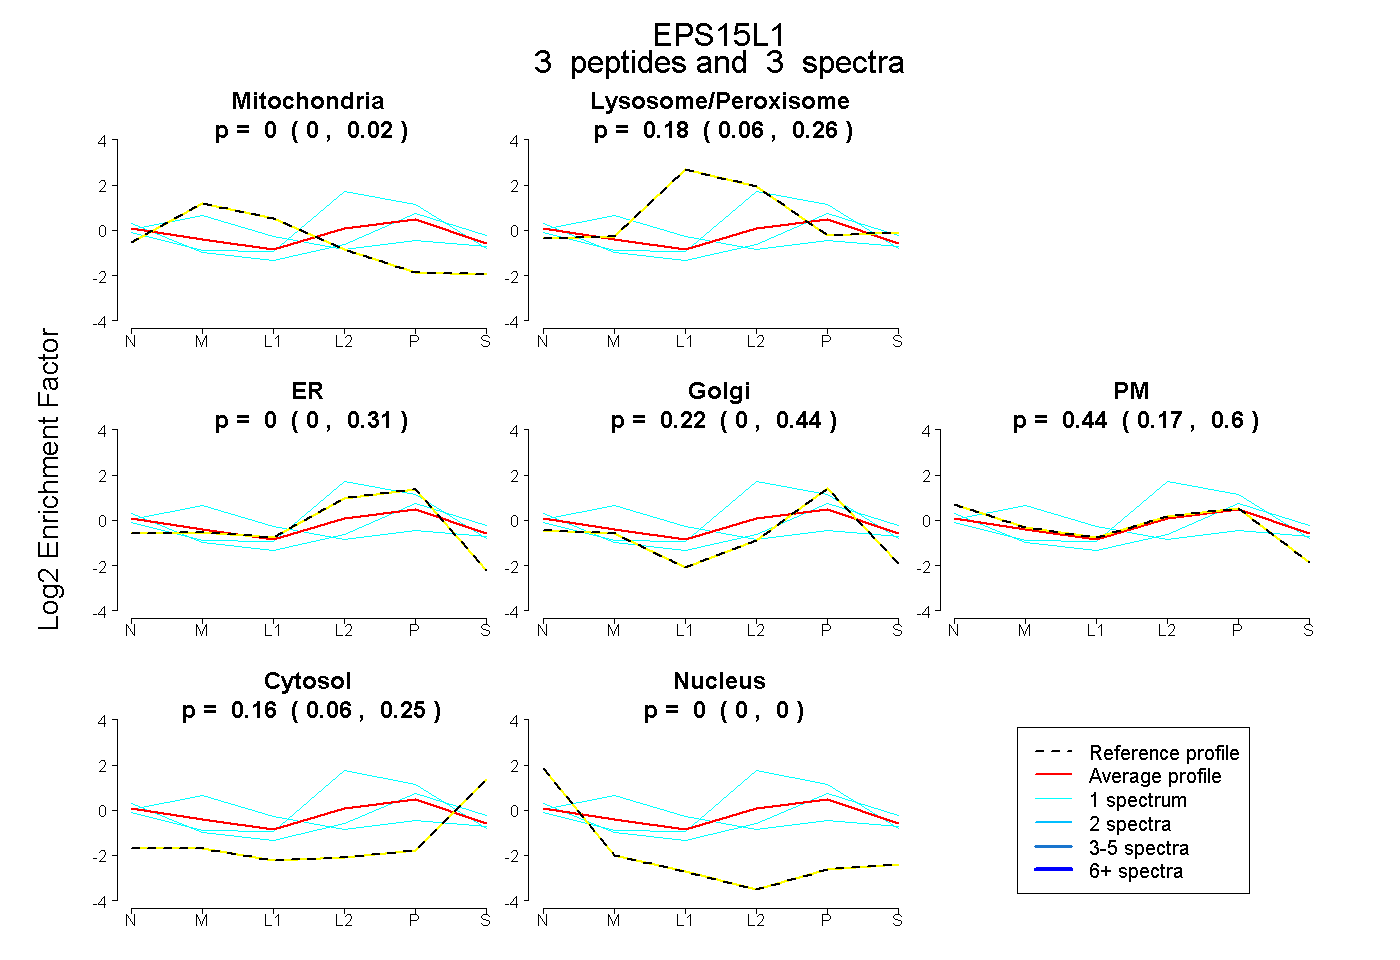
0.000 | 0.023
0.064 | 0.259
0.000 | 0.307
0.000 | 0.438
0.174 | 0.604
0.057 | 0.249
0.000 | 0.000
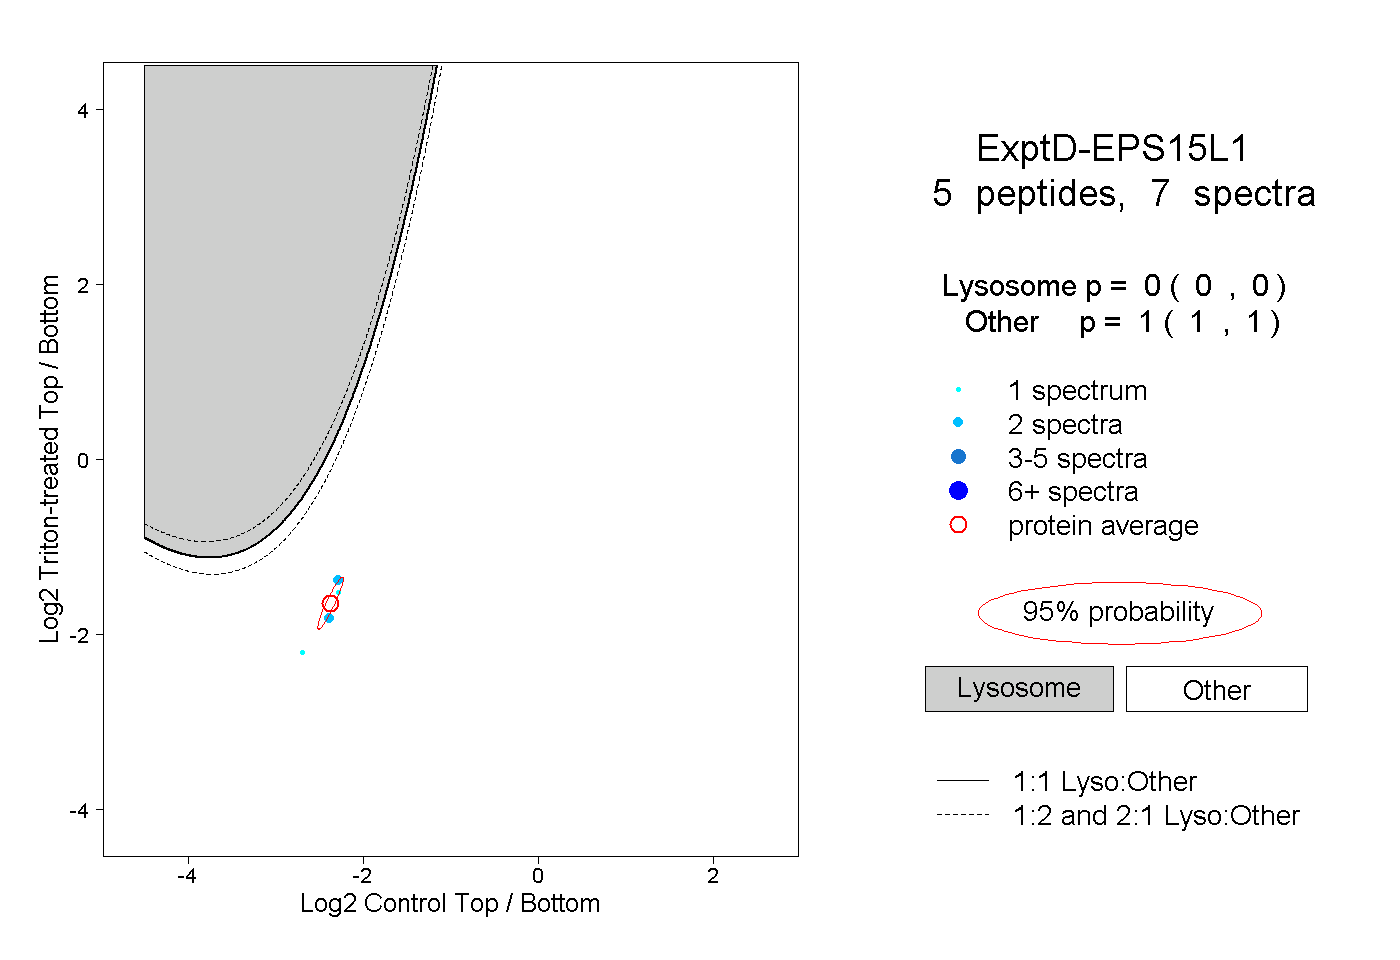
10peptides
spectra
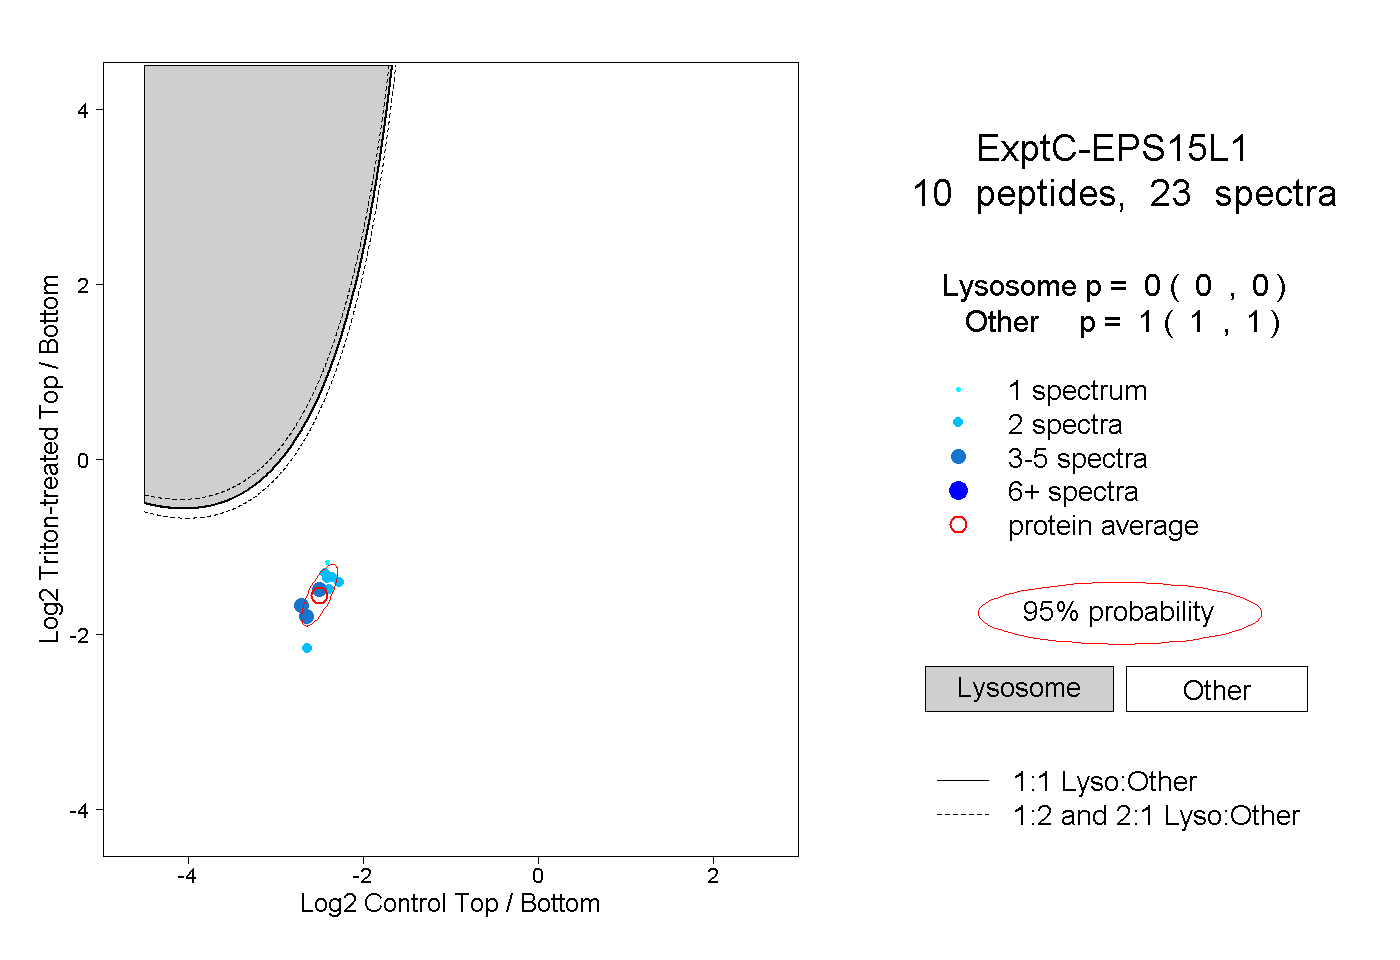
0.000 | 0.000
1.000 | 1.000