 4
4peptides
spectra
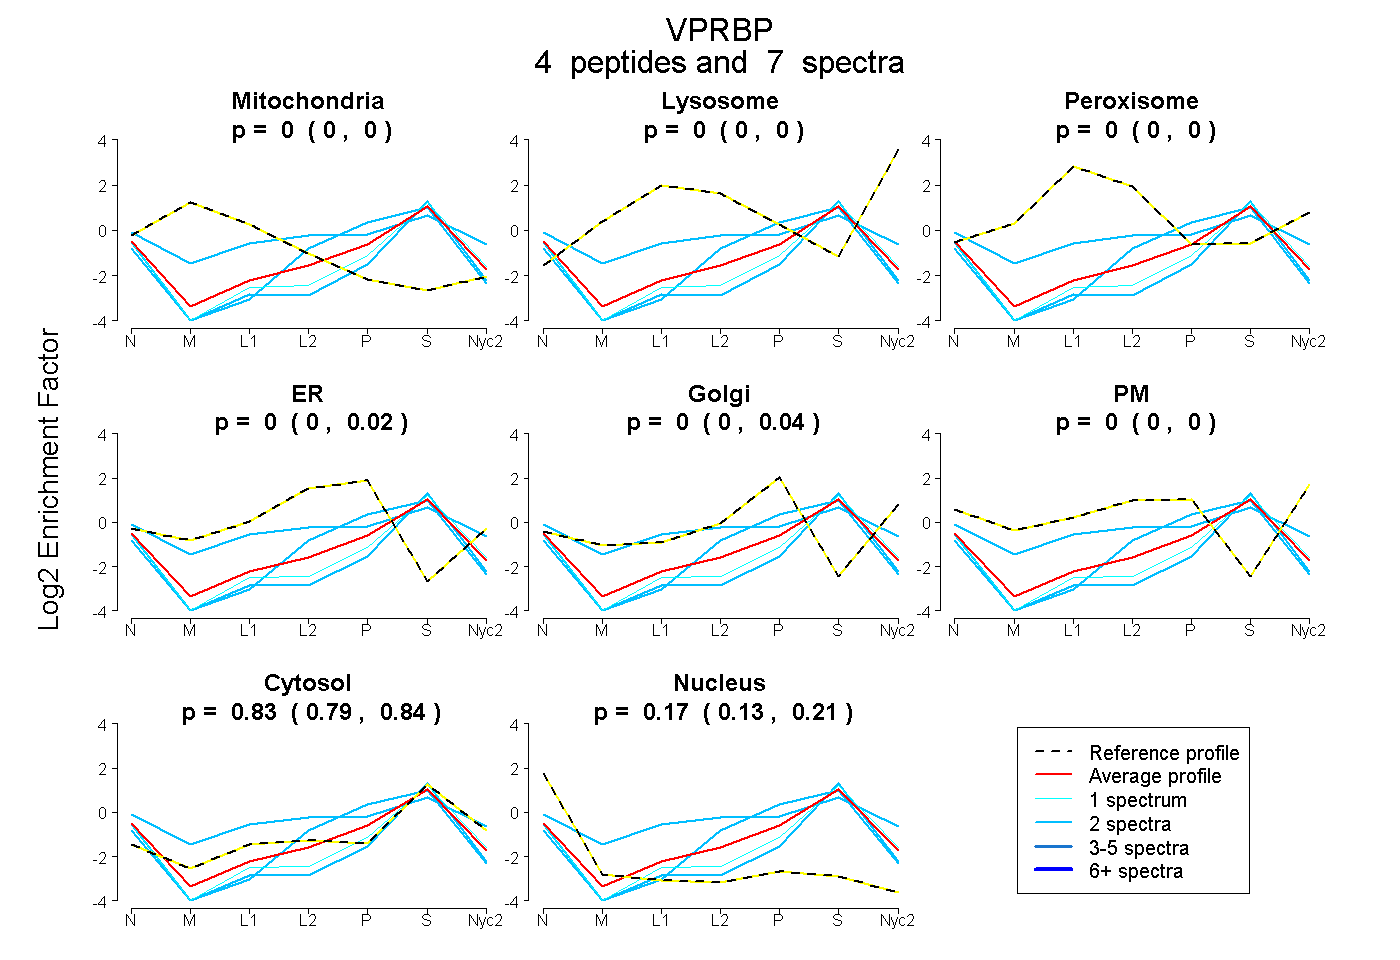
0.000 | 0.000
0.000 | 0.000
0.000 | 0.000
0.000 | 0.023
0.000 | 0.038
0.000 | 0.000
0.786 | 0.842
0.129 | 0.206
2peptides
spectra
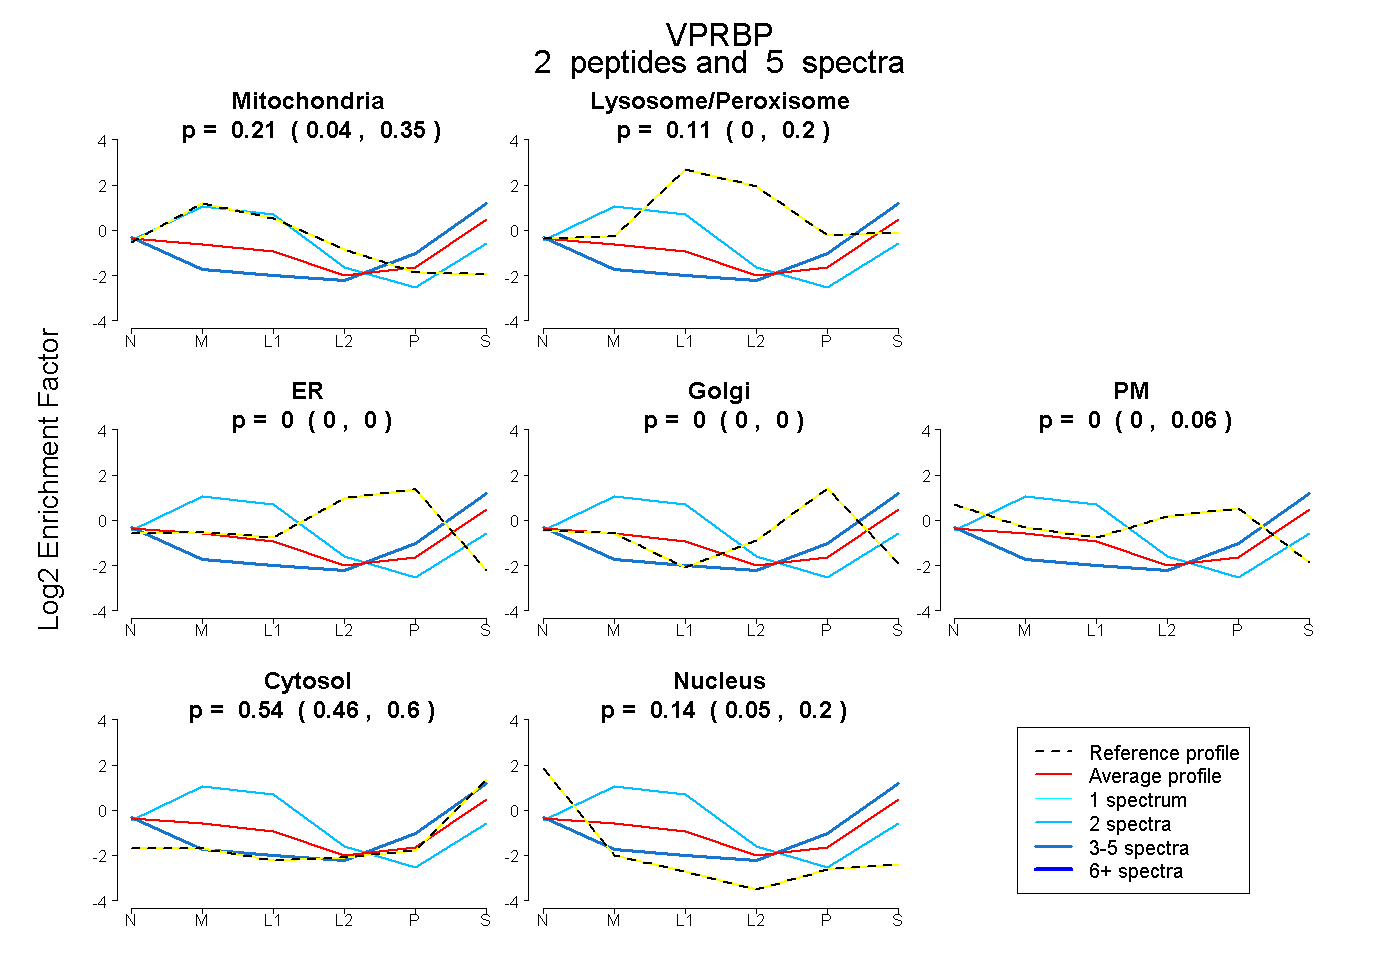
0.037 | 0.353
0.000 | 0.199
0.000 | 0.000
0.000 | 0.000
0.000 | 0.062
0.456 | 0.601
0.054 | 0.205
1peptide
spectra
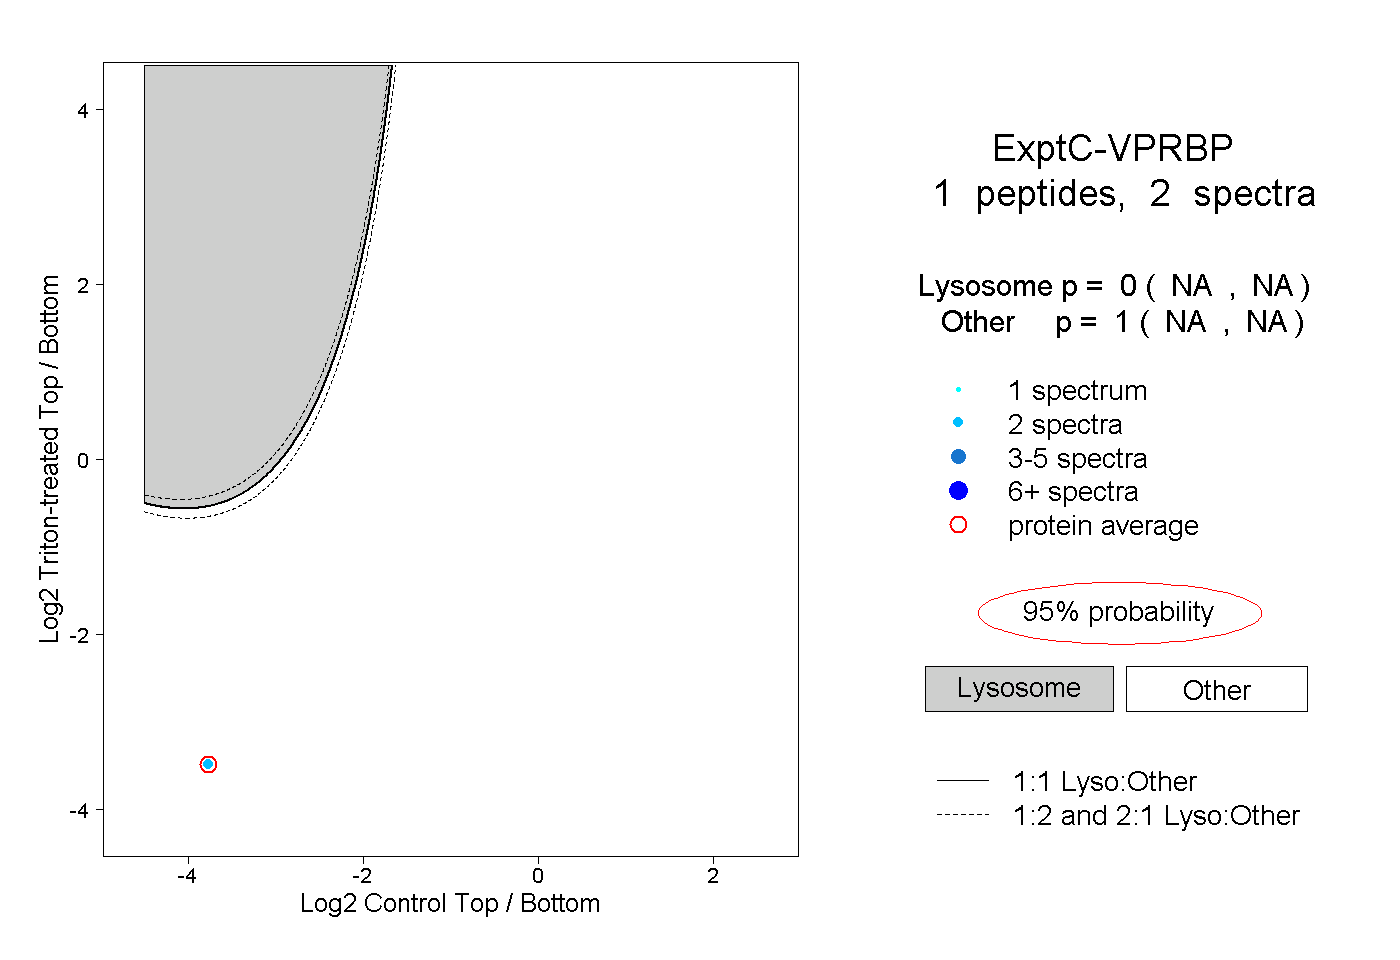
NA | NA
NA | NA