 9
9peptides
spectra
0.892 | 0.907
0.000 | 0.000
0.000 | 0.000
0.000 | 0.000
0.000 | 0.000
0.000 | 0.000
0.000 | 0.000
0.092 | 0.107
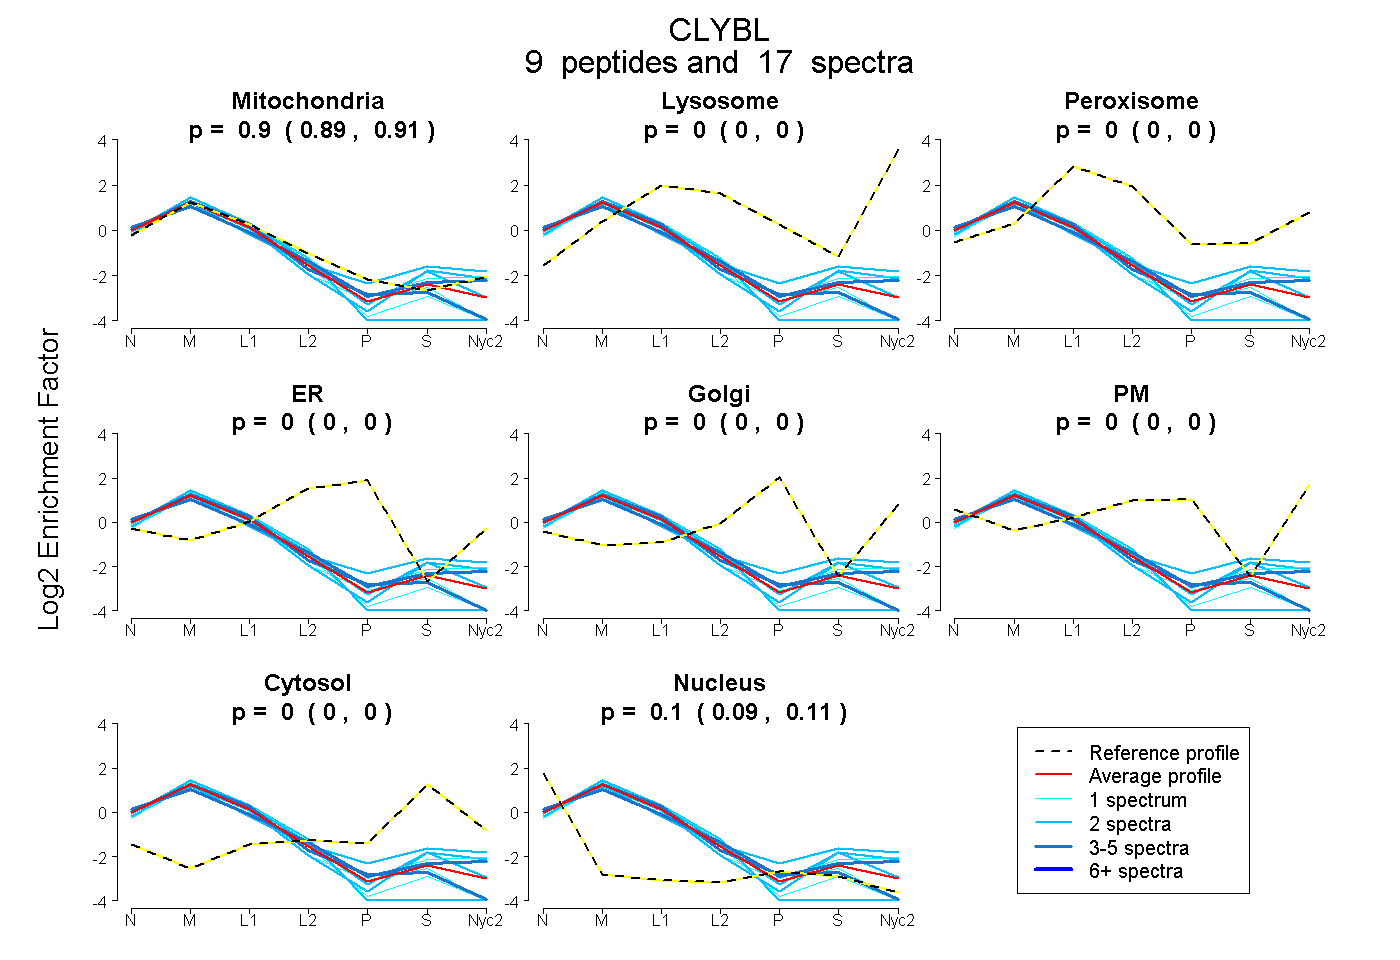
| Plot | Mito | Lyso | Perox | ER | Golgi | PM | Cytosol | Nucleus | |||||
| Expt A |
9 peptides |
17 spectra |
|
0.900 0.892 | 0.907 |
0.000 0.000 | 0.000 |
0.000 0.000 | 0.000 |
0.000 0.000 | 0.000 |
0.000 0.000 | 0.000 |
0.000 0.000 | 0.000 |
0.000 0.000 | 0.000 |
0.100 0.092 | 0.107 |
| 1 spectrum, AVCEETLK | 0.861 | 0.000 | 0.000 | 0.000 | 0.000 | 0.000 | 0.000 | 0.139 | ||
| 3 spectra, WAEELIAAFK | 0.898 | 0.000 | 0.000 | 0.000 | 0.000 | 0.000 | 0.000 | 0.102 | ||
| 1 spectrum, ASIGATSNK | 0.849 | 0.000 | 0.000 | 0.000 | 0.000 | 0.000 | 0.000 | 0.151 | ||
| 1 spectrum, QAQNIVTLATSIK | 0.965 | 0.000 | 0.000 | 0.000 | 0.000 | 0.000 | 0.035 | 0.000 | ||
| 2 spectra, EAAAMGFTGK | 0.914 | 0.000 | 0.000 | 0.000 | 0.000 | 0.000 | 0.000 | 0.086 | ||
| 2 spectra, DTQDILYAR | 0.887 | 0.000 | 0.000 | 0.000 | 0.000 | 0.000 | 0.035 | 0.079 | ||
| 3 spectra, VEGPEEIQWFSDK | 0.861 | 0.000 | 0.000 | 0.000 | 0.000 | 0.000 | 0.000 | 0.139 | ||
| 2 spectra, DEDGLLR | 0.857 | 0.000 | 0.000 | 0.000 | 0.000 | 0.000 | 0.143 | 0.000 | ||
| 2 spectra, GAFTFQGSMIDMPLLK | 0.892 | 0.000 | 0.000 | 0.000 | 0.000 | 0.000 | 0.000 | 0.108 |
| Plot | Mito | Lyso or Perox | ER | Golgi | PM | Cytosol | Nucleus | ||||||
| Expt B |
5 peptides |
7 spectra |
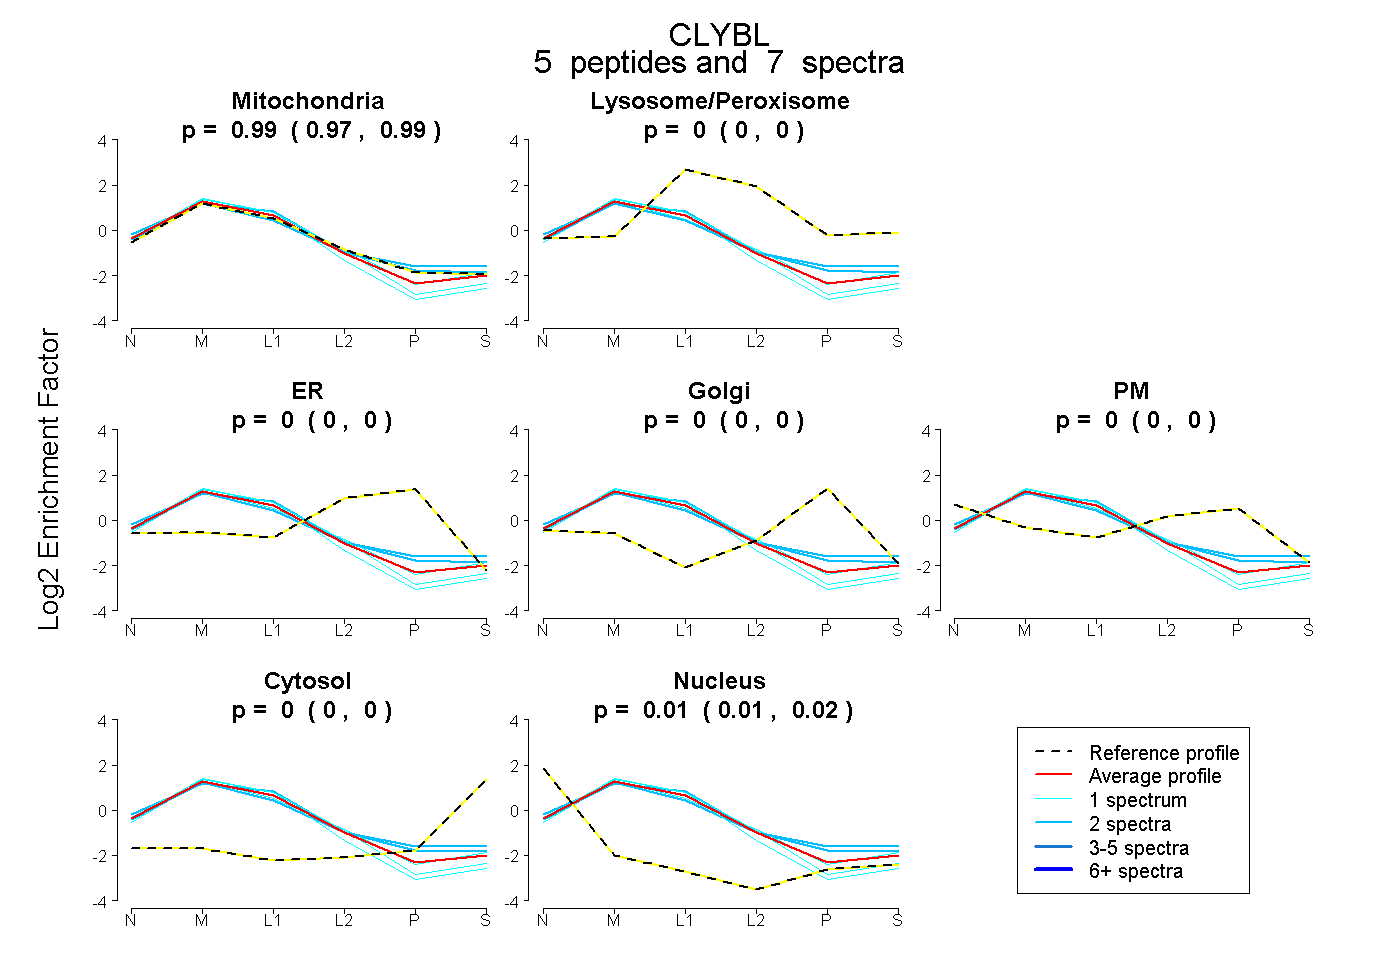 |
0.985 0.975 | 0.993 |
0.000 0.000 | 0.000 |
0.000 0.000 | 0.000 |
0.000 0.000 | 0.000 |
0.000 0.000 | 0.000 |
0.000 0.000 | 0.000 |
0.015 0.005 | 0.024 |
|||
| Plot | Lyso | Other | |||||||||||
| Expt C |
10 peptides |
54 spectra |
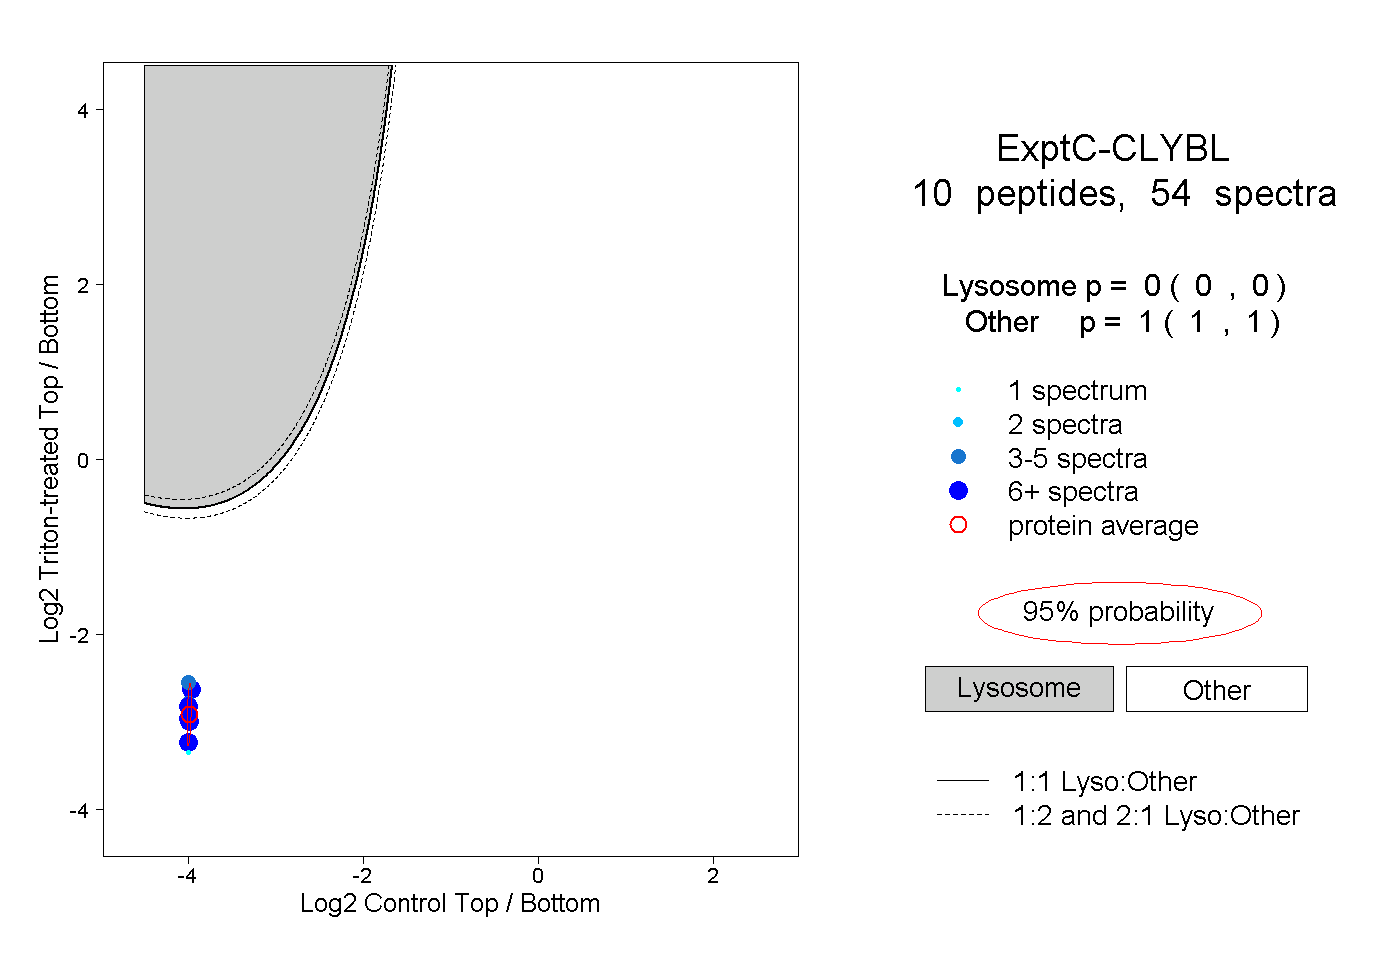 |
0.000 0.000 | 0.000 |
1.000 1.000 | 1.000 |
||||||||
| Plot | Lyso | Other | |||||||||||
| Expt D |
5 peptides |
8 spectra |
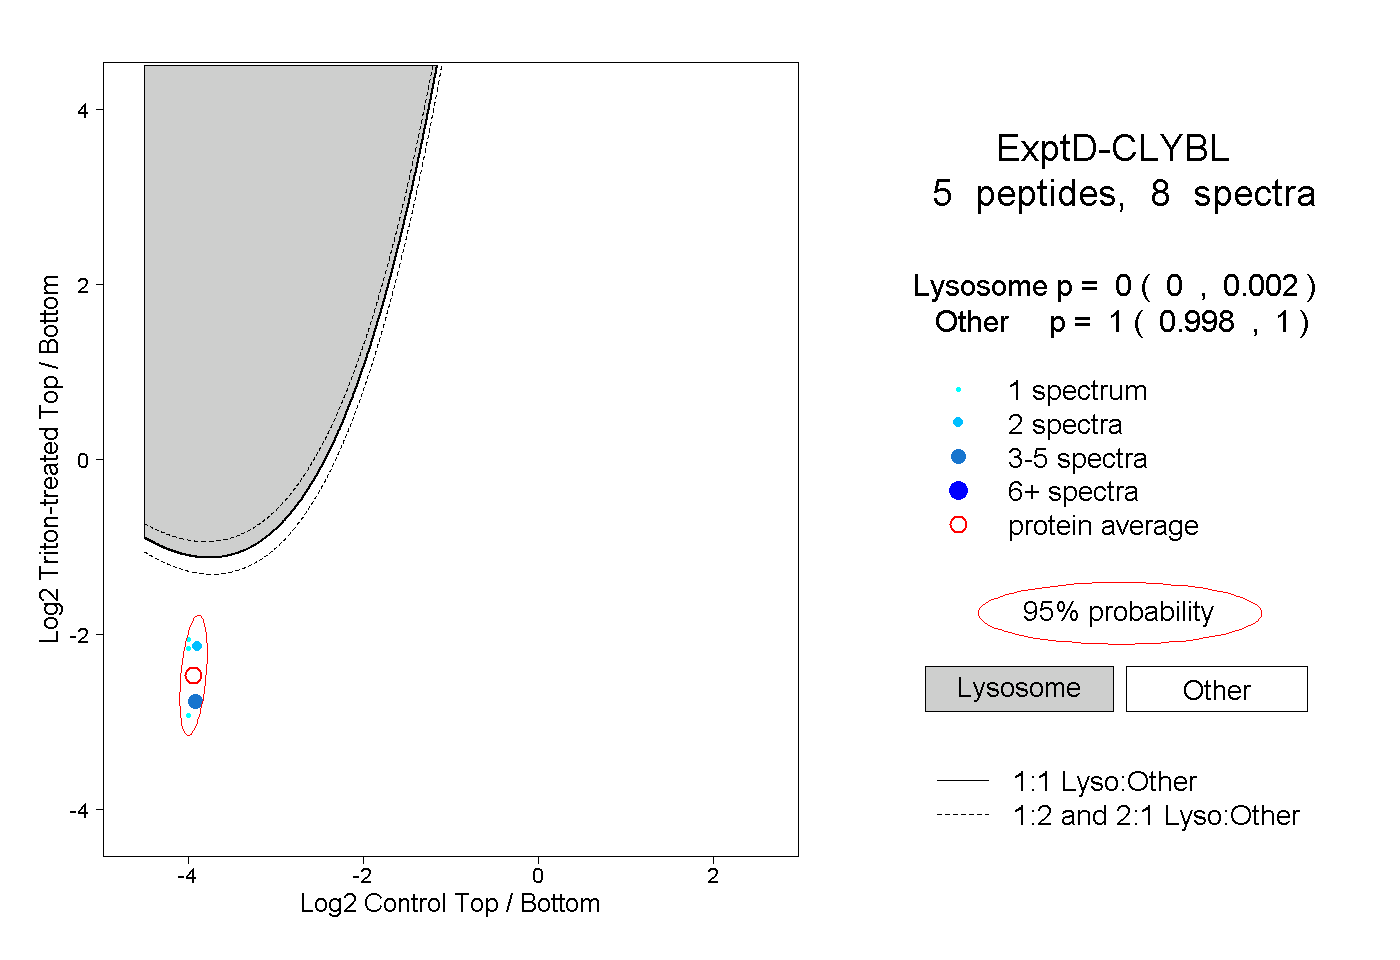 |
0.000 0.000 | 0.002 |
1.000 0.998 | 1.000 |