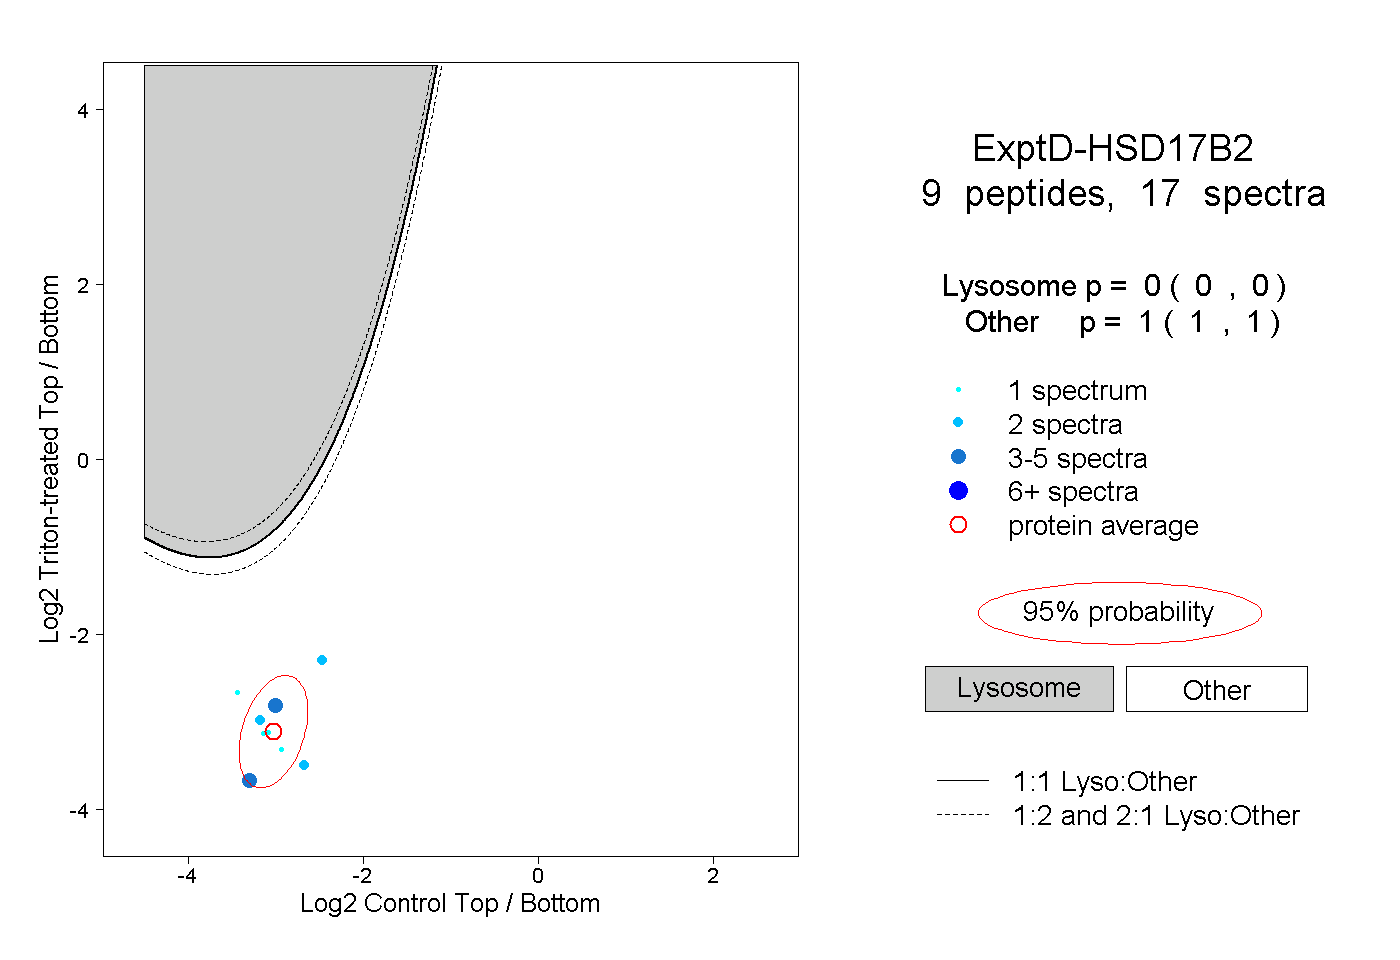
15
15peptides
spectra
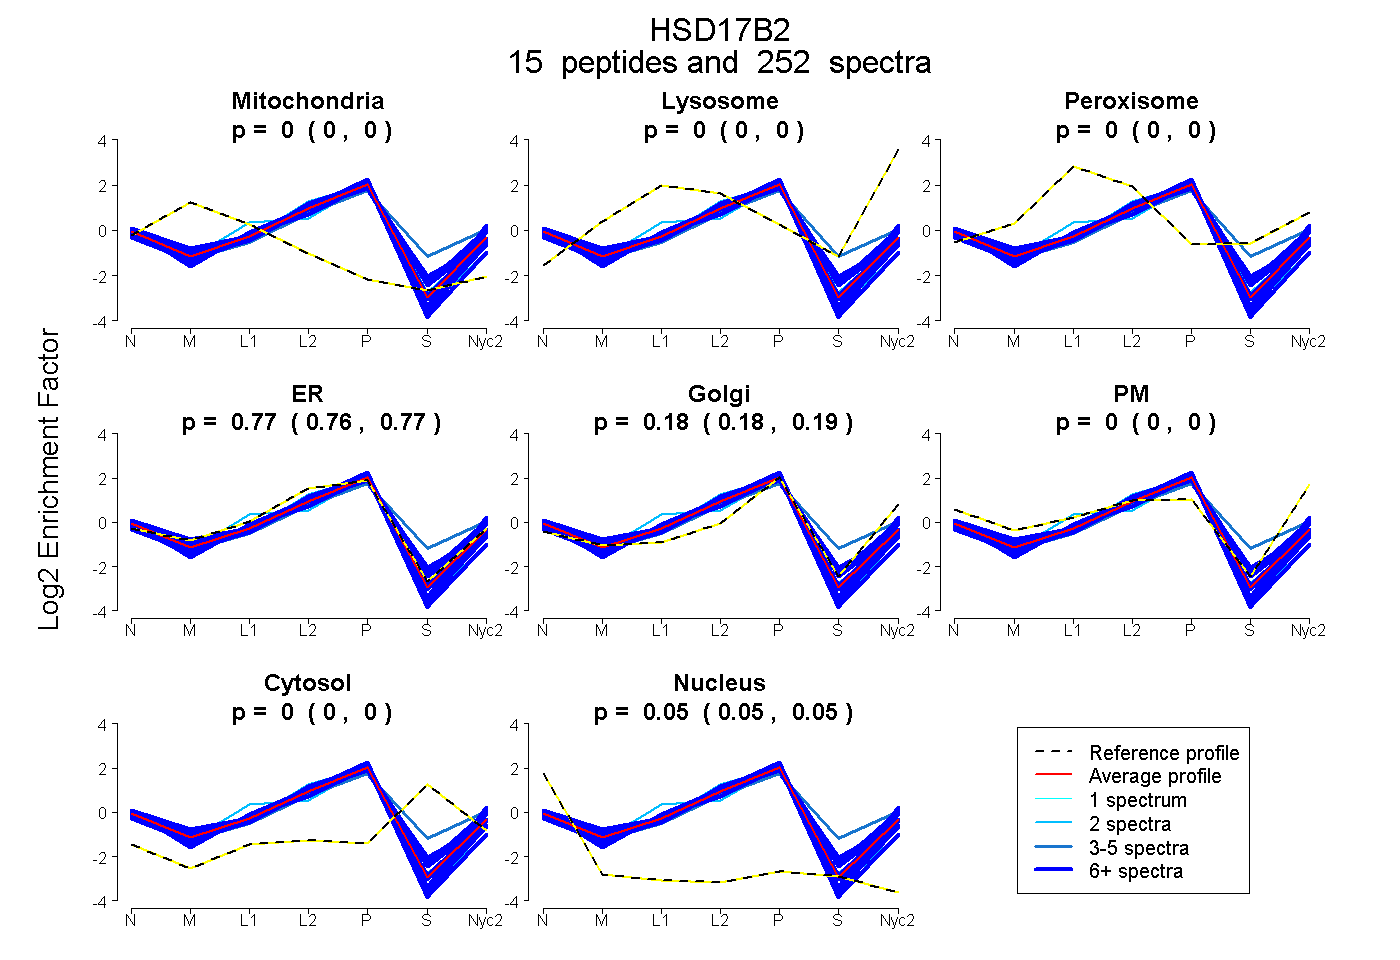
0.000 | 0.000
0.000 | 0.000
0.000 | 0.000
0.763 | 0.769
0.179 | 0.187
0.000 | 0.000
0.000 | 0.000
0.049 | 0.051
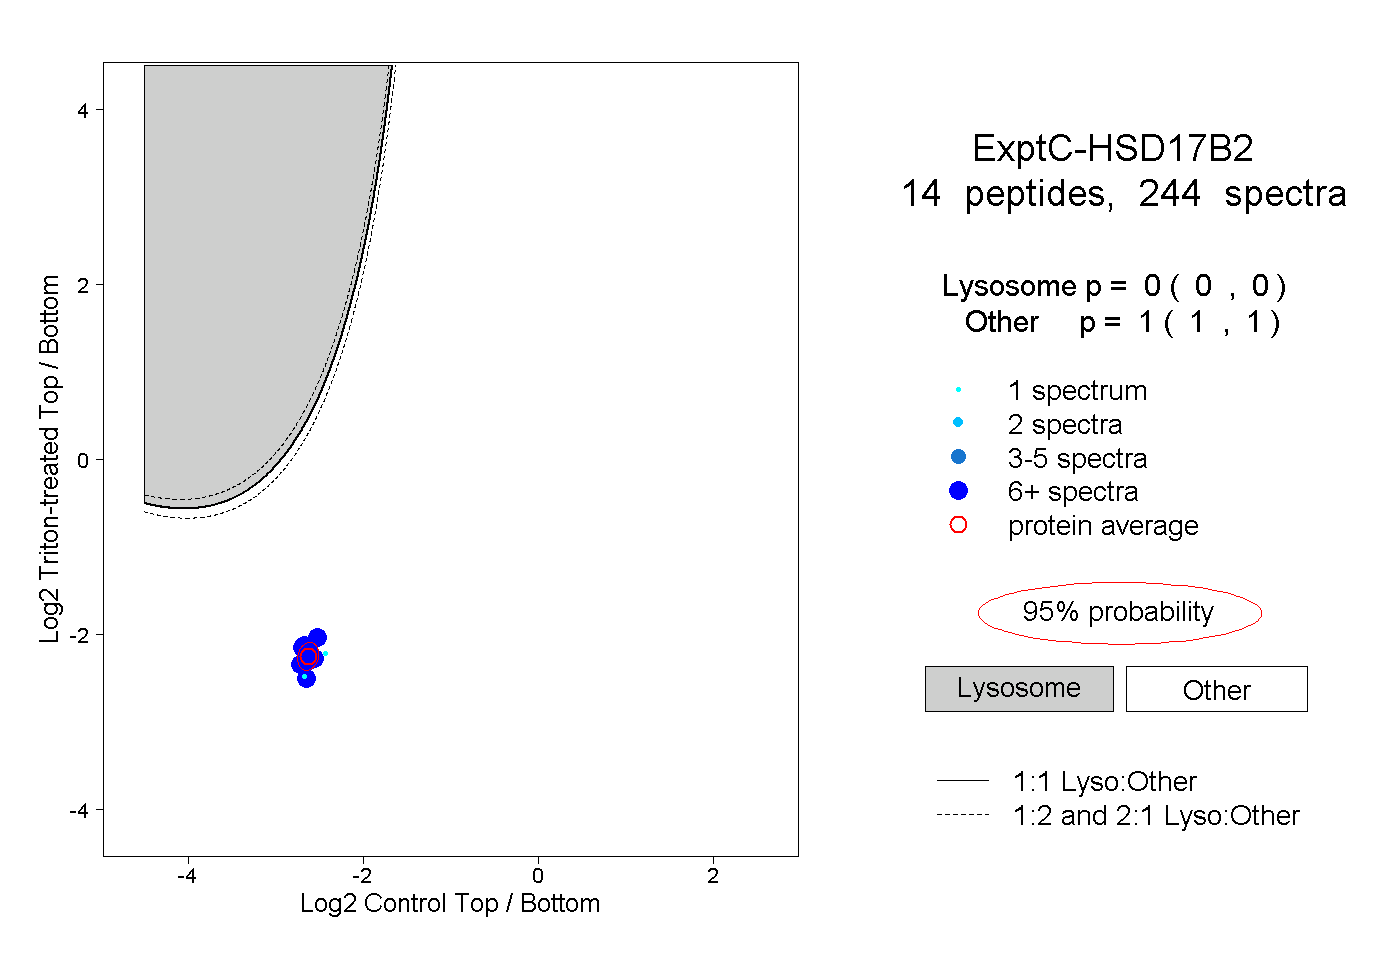
14peptides
spectra

0.000 | 0.000
0.000 | 0.000
0.852 | 0.869
0.113 | 0.135
0.000 | 0.000
0.000 | 0.000
0.010 | 0.016