 15
15peptides
spectra
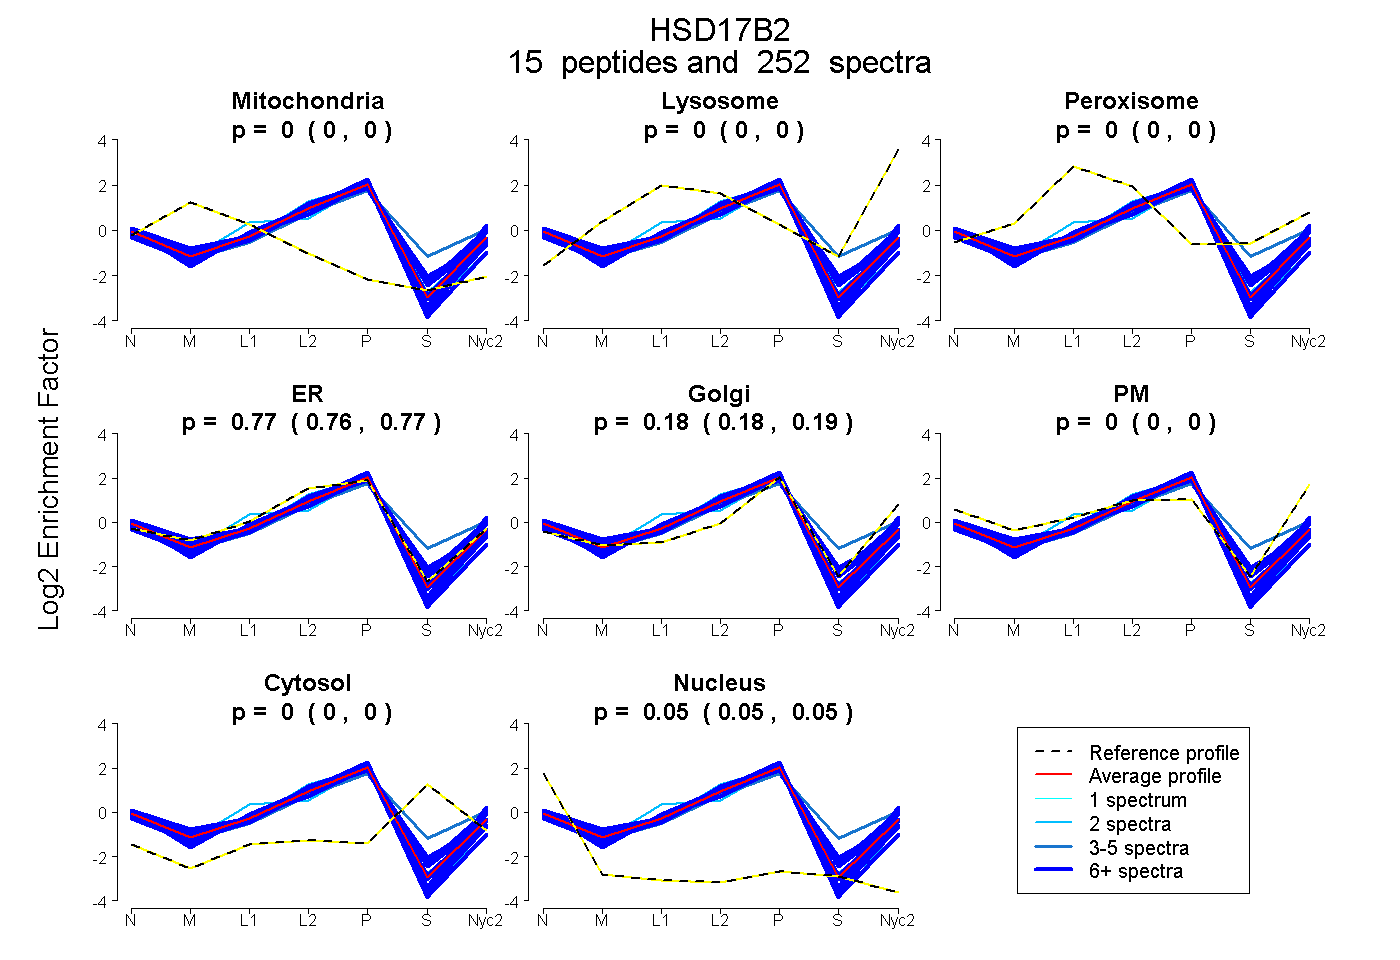
0.000 | 0.000
0.000 | 0.000
0.000 | 0.000
0.763 | 0.769
0.179 | 0.187
0.000 | 0.000
0.000 | 0.000
0.049 | 0.051
| Plot | Mito | Lyso | Perox | ER | Golgi | PM | Cytosol | Nucleus | |||||
| Expt A |
15 peptides |
252 spectra |
|
0.000 0.000 | 0.000 |
0.000 0.000 | 0.000 |
0.000 0.000 | 0.000 |
0.766 0.763 | 0.769 |
0.184 0.179 | 0.187 |
0.000 0.000 | 0.000 |
0.000 0.000 | 0.000 |
0.050 0.049 | 0.051 |
| 12 spectra, LGFTVFAGVLDK | 0.000 | 0.000 | 0.000 | 0.650 | 0.264 | 0.048 | 0.026 | 0.013 | ||
| 8 spectra, EGPGAEELR | 0.000 | 0.000 | 0.000 | 0.671 | 0.289 | 0.032 | 0.000 | 0.008 | ||
| 6 spectra, EIQENYGQEYVHTQK | 0.000 | 0.000 | 0.000 | 0.791 | 0.108 | 0.000 | 0.073 | 0.027 | ||
| 2 spectra, CMAVNFFGAVEVTK | 0.000 | 0.000 | 0.000 | 0.913 | 0.000 | 0.000 | 0.000 | 0.087 | ||
| 2 spectra, AVLVTGADSGFGHALAK | 0.000 | 0.000 | 0.000 | 0.757 | 0.190 | 0.000 | 0.000 | 0.053 | ||
| 5 spectra, DVHSEVAEK | 0.000 | 0.000 | 0.000 | 0.510 | 0.252 | 0.038 | 0.200 | 0.000 | ||
| 54 spectra, AAISMFSAVIR | 0.000 | 0.000 | 0.000 | 0.739 | 0.241 | 0.000 | 0.000 | 0.020 | ||
| 42 spectra, LALPVMR | 0.000 | 0.000 | 0.000 | 0.837 | 0.106 | 0.000 | 0.000 | 0.057 | ||
| 11 spectra, EMSNPDITPVLR | 0.000 | 0.000 | 0.000 | 0.840 | 0.127 | 0.000 | 0.000 | 0.033 | ||
| 9 spectra, NYFTPK | 0.000 | 0.000 | 0.000 | 0.733 | 0.209 | 0.000 | 0.000 | 0.059 | ||
| 26 spectra, AWSSGQLR | 0.000 | 0.000 | 0.000 | 0.760 | 0.180 | 0.000 | 0.000 | 0.060 | ||
| 18 spectra, DIQHAICAK | 0.000 | 0.000 | 0.000 | 0.796 | 0.080 | 0.000 | 0.079 | 0.046 | ||
| 7 spectra, EILDHFSK | 0.000 | 0.000 | 0.000 | 0.684 | 0.244 | 0.000 | 0.017 | 0.055 | ||
| 39 spectra, VFLPLLR | 0.000 | 0.000 | 0.000 | 0.760 | 0.213 | 0.000 | 0.000 | 0.028 | ||
| 11 spectra, NHSSFYCSGR | 0.000 | 0.000 | 0.000 | 0.903 | 0.000 | 0.000 | 0.000 | 0.097 |
| Plot | Mito | Lyso or Perox | ER | Golgi | PM | Cytosol | Nucleus | ||||||
| Expt B |
14 peptides |
77 spectra |
 |
0.000 0.000 | 0.000 |
0.000 0.000 | 0.000 |
0.861 0.852 | 0.869 |
0.125 0.113 | 0.135 |
0.000 0.000 | 0.000 |
0.000 0.000 | 0.000 |
0.013 0.010 | 0.016 |
|||
| Plot | Lyso | Other | |||||||||||
| Expt C |
14 peptides |
244 spectra |
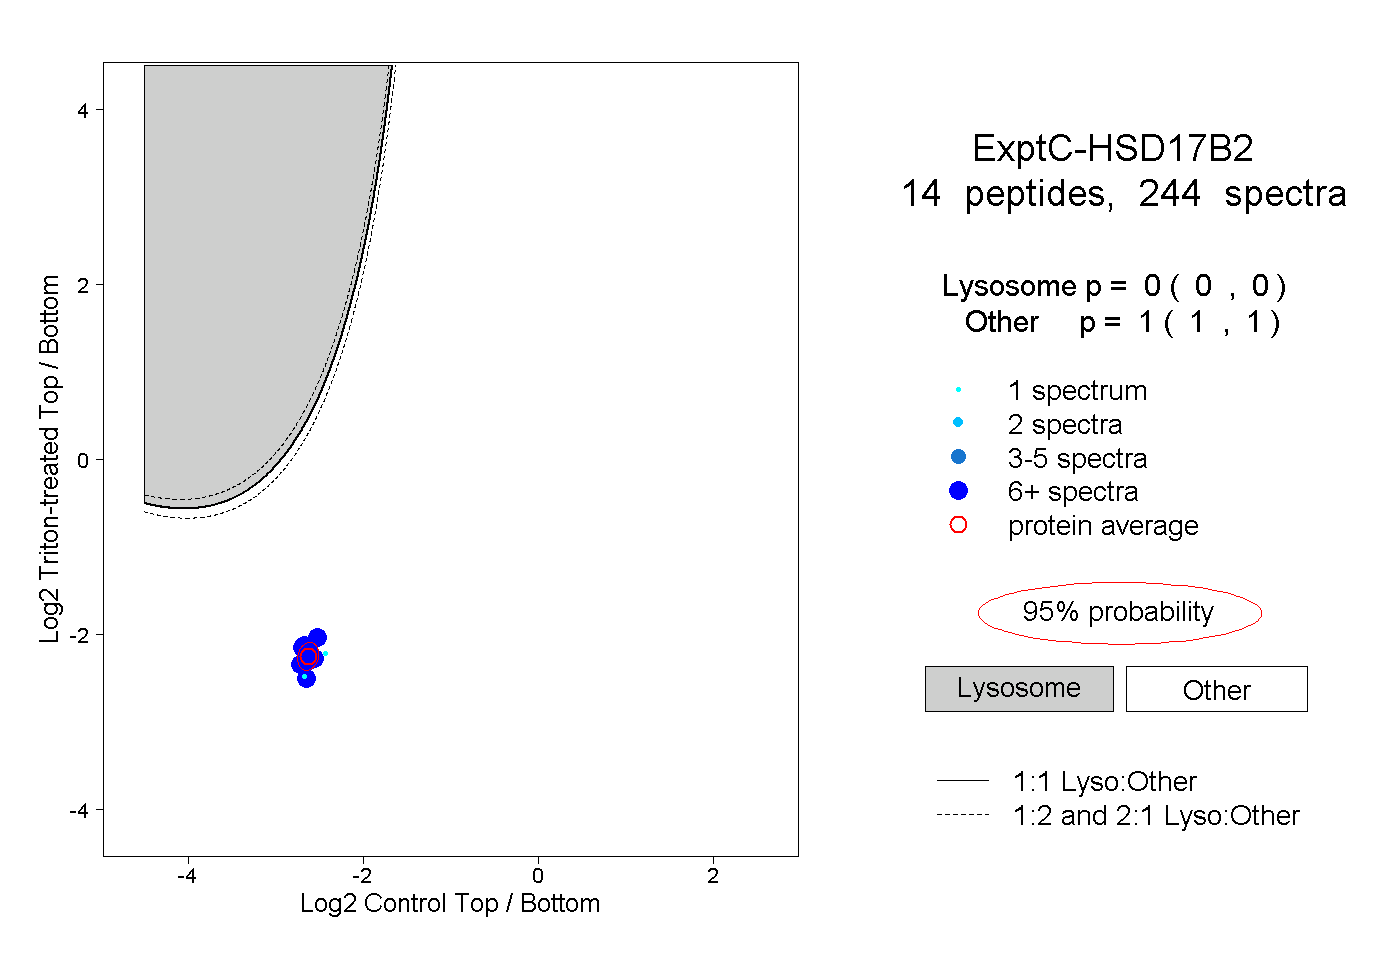 |
0.000 0.000 | 0.000 |
1.000 1.000 | 1.000 |
||||||||
| Plot | Lyso | Other | |||||||||||
| Expt D |
9 peptides |
17 spectra |
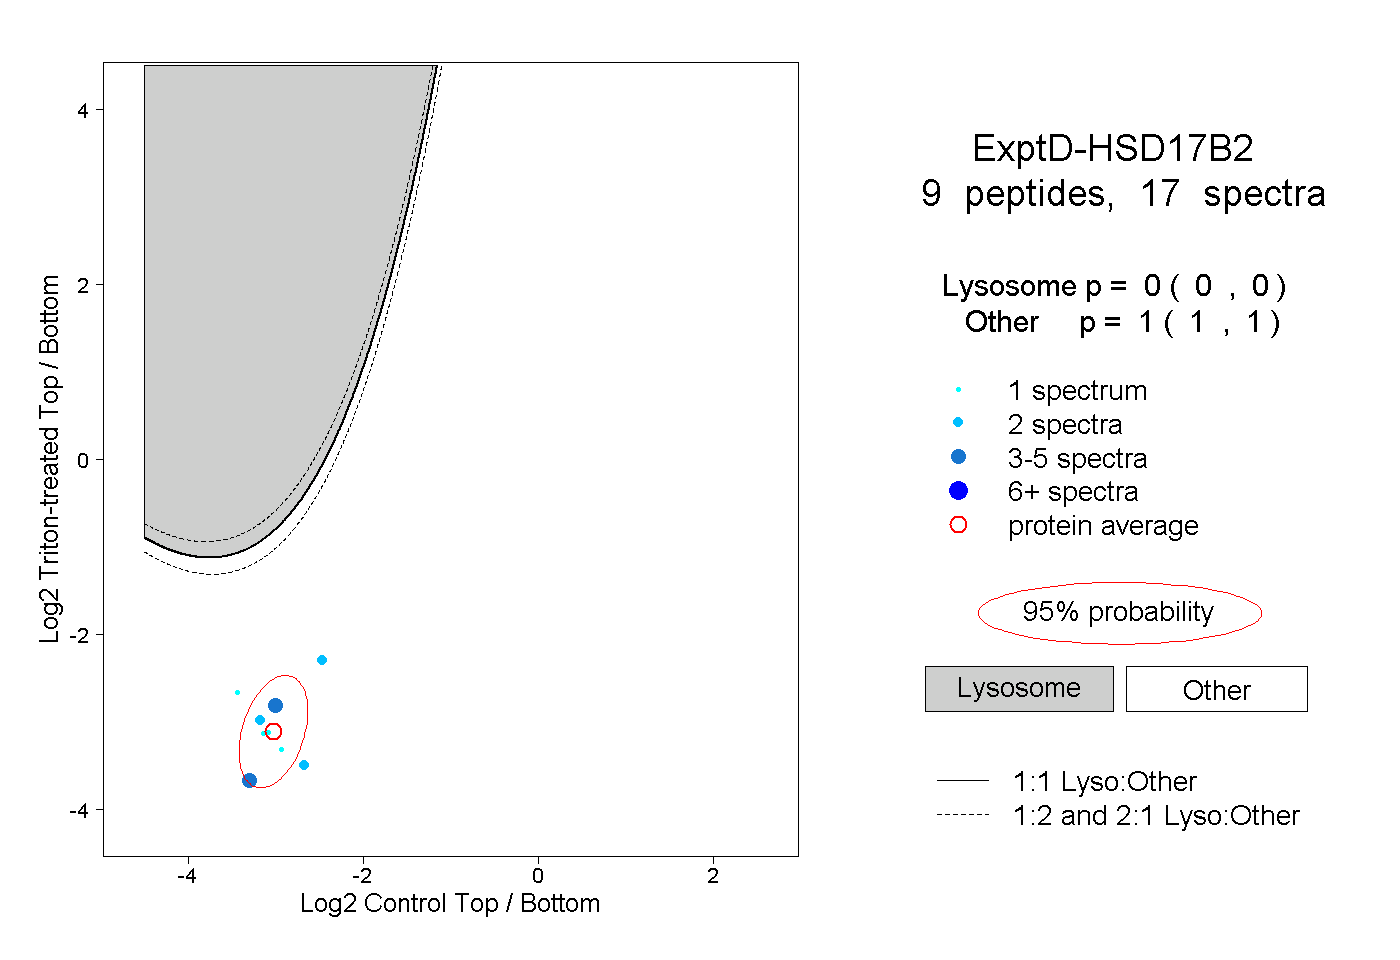 |
0.000 0.000 | 0.000 |
1.000 1.000 | 1.000 |