 3
3peptides
spectra
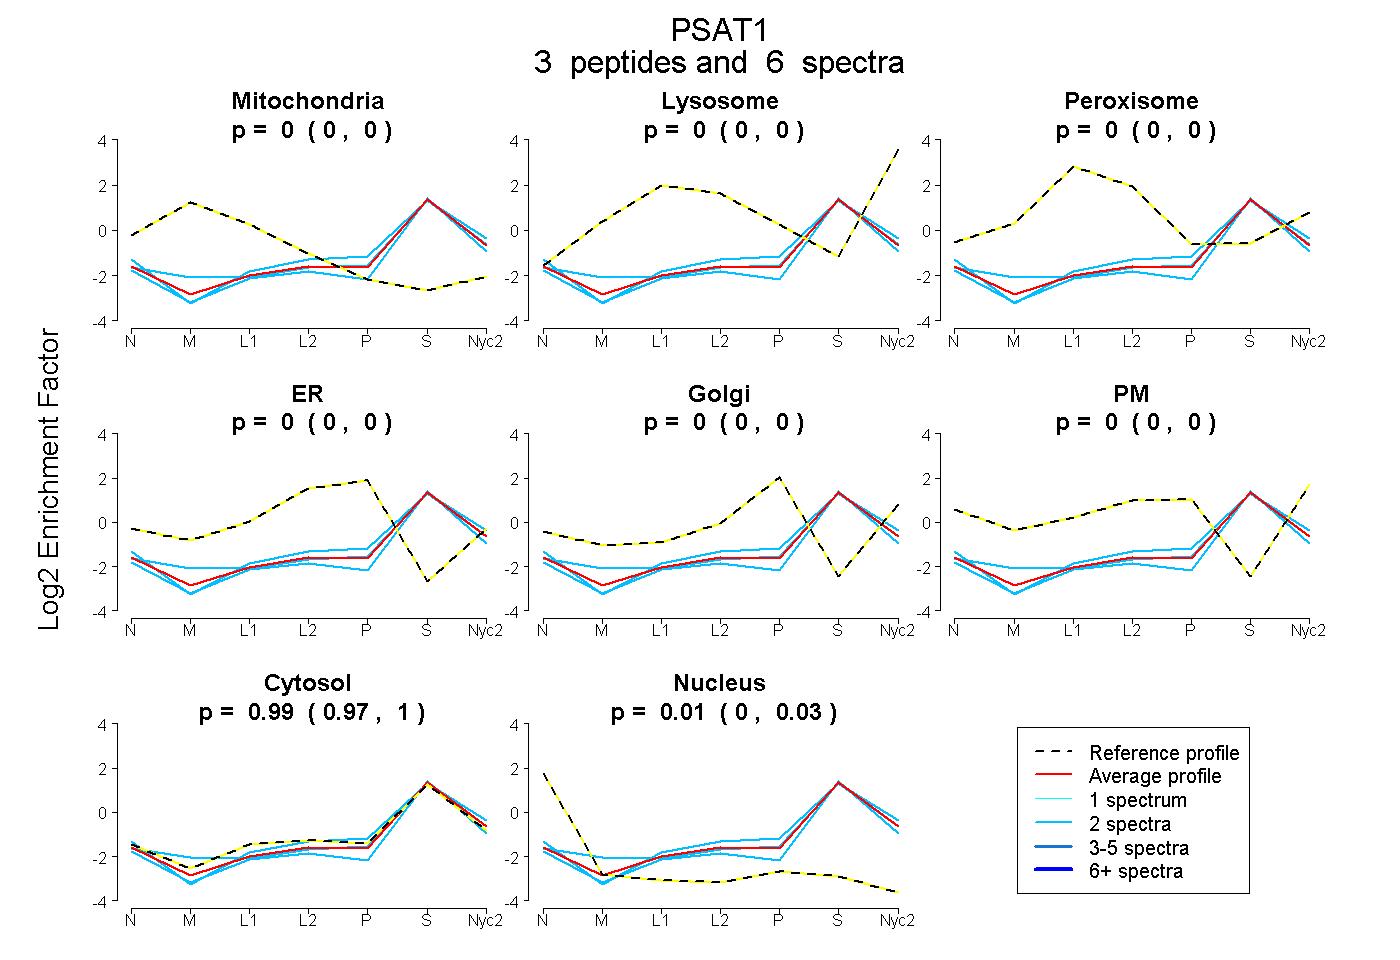
0.000 | 0.000
0.000 | 0.000
0.000 | 0.000
0.000 | 0.000
0.000 | 0.000
0.000 | 0.000
0.972 | 1.000
0.000 | 0.026
| Plot | Mito | Lyso | Perox | ER | Golgi | PM | Cytosol | Nucleus | |||||
| Expt A |
3 peptides |
6 spectra |
|
0.000 0.000 | 0.000 |
0.000 0.000 | 0.000 |
0.000 0.000 | 0.000 |
0.000 0.000 | 0.000 |
0.000 0.000 | 0.000 |
0.000 0.000 | 0.000 |
0.987 0.972 | 1.000 |
0.013 0.000 | 0.026 |
| 2 spectra, MNIPFR | 0.000 | 0.000 | 0.000 | 0.000 | 0.000 | 0.000 | 0.958 | 0.042 | ||
| 2 spectra, IISNTENLVR | 0.000 | 0.000 | 0.000 | 0.000 | 0.000 | 0.000 | 1.000 | 0.000 | ||
| 2 spectra, FGVIFAGAQK | 0.000 | 0.000 | 0.000 | 0.000 | 0.000 | 0.000 | 0.995 | 0.005 |
| Plot | Mito | Lyso or Perox | ER | Golgi | PM | Cytosol | Nucleus | ||||||
| Expt B |
1 peptide |
1 spectrum |
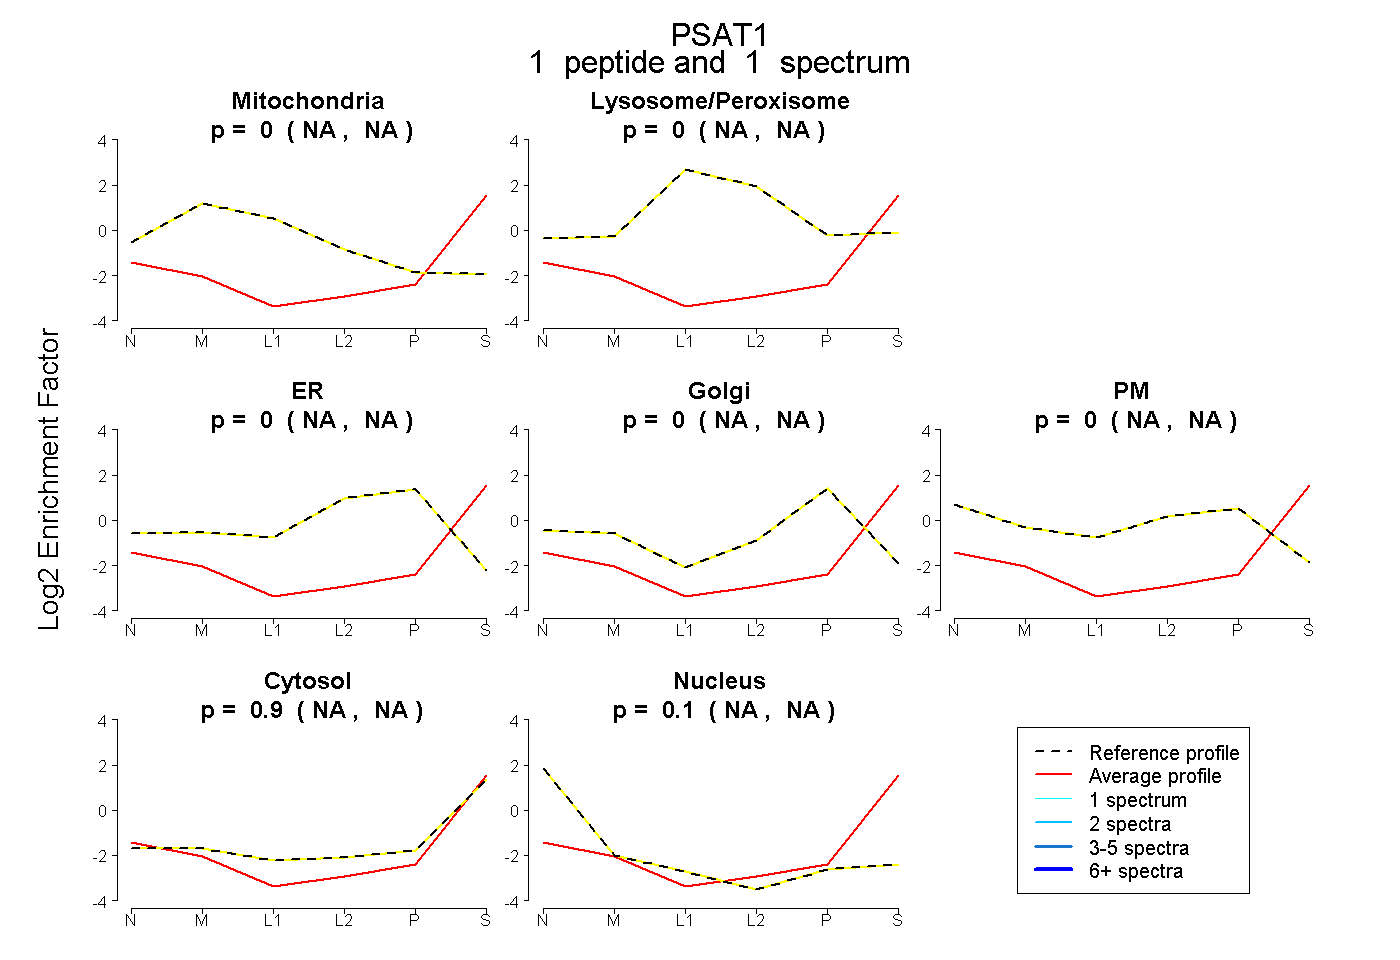 |
0.000 NA | NA |
0.000 NA | NA |
0.000 NA | NA |
0.000 NA | NA |
0.000 NA | NA |
0.904 NA | NA |
0.096 NA | NA |
|||
| Plot | Lyso | Other | |||||||||||
| Expt C |
1 peptide |
1 spectrum |
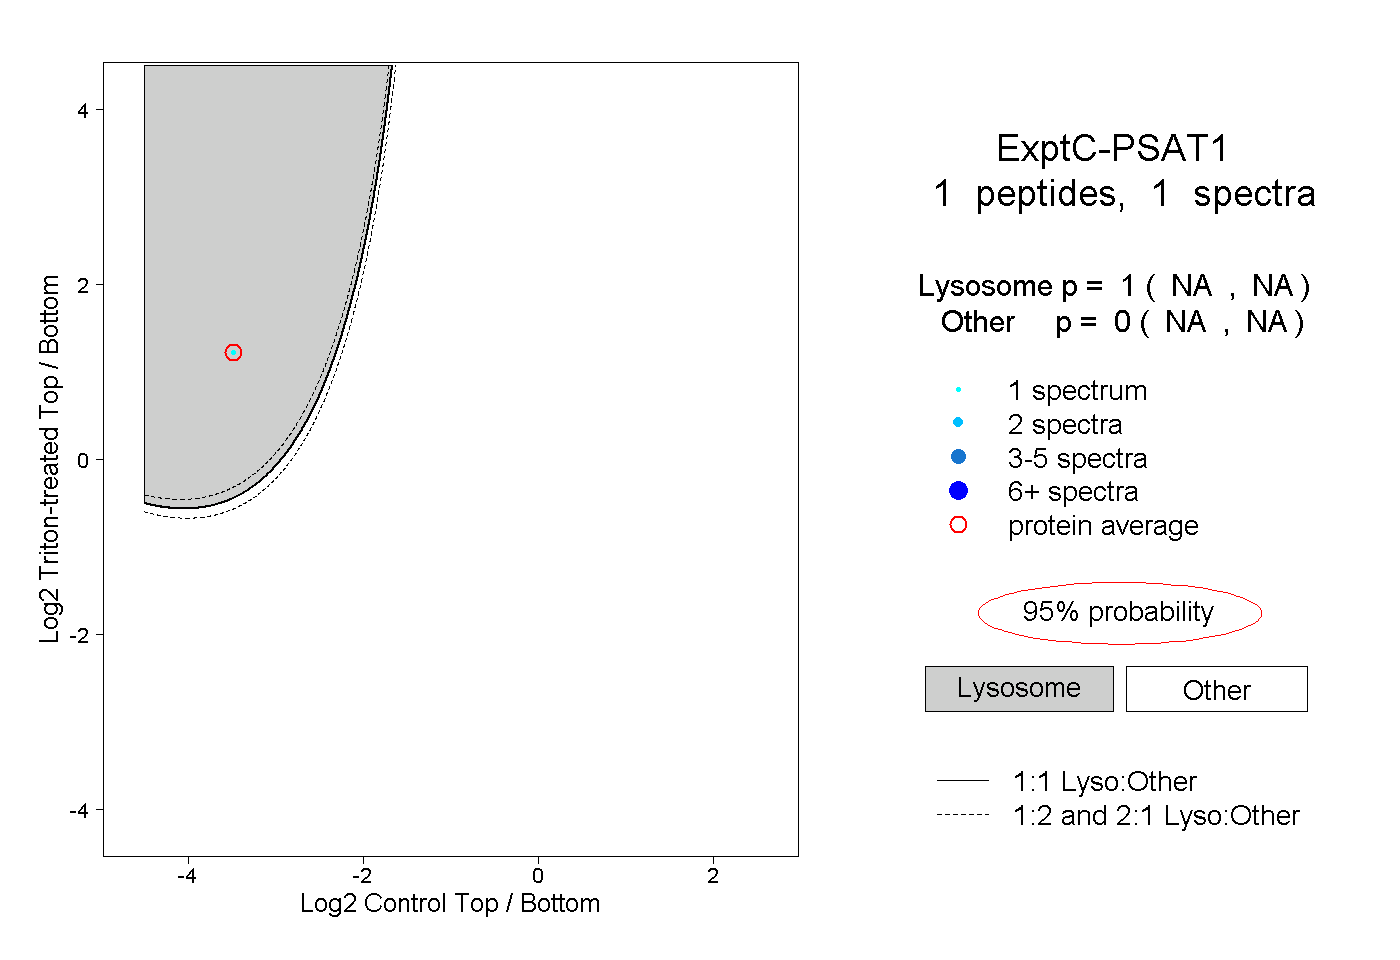 |
1.000 NA | NA |
0.000 NA | NA |