 4
4peptides
spectra
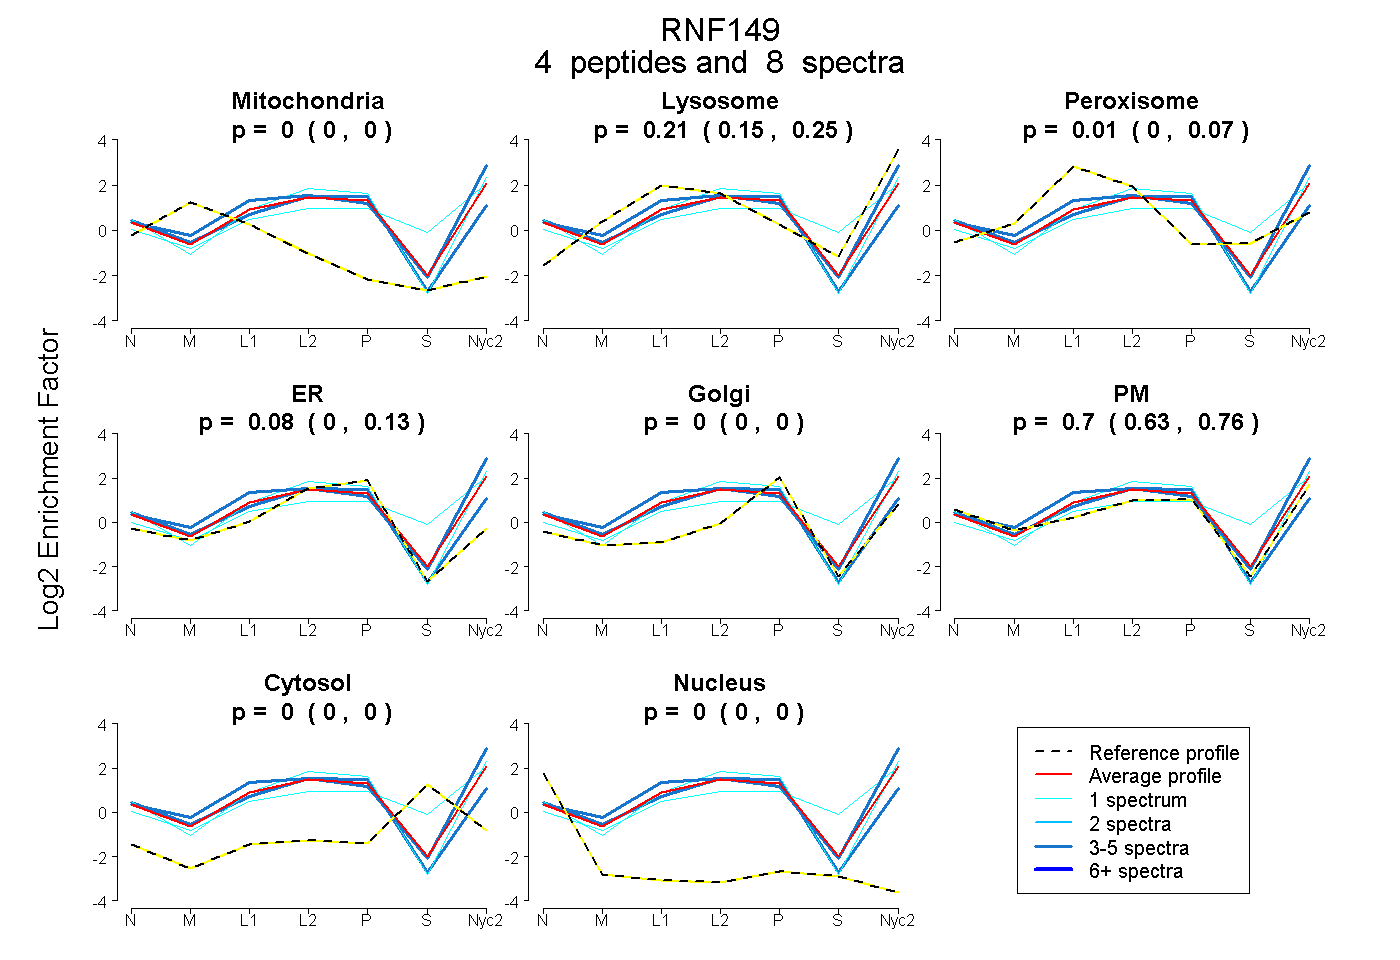
0.000 | 0.000
0.151 | 0.247
0.000 | 0.075
0.000 | 0.130
0.000 | 0.000
0.628 | 0.762
0.000 | 0.000
0.000 | 0.000
1peptide
spectra
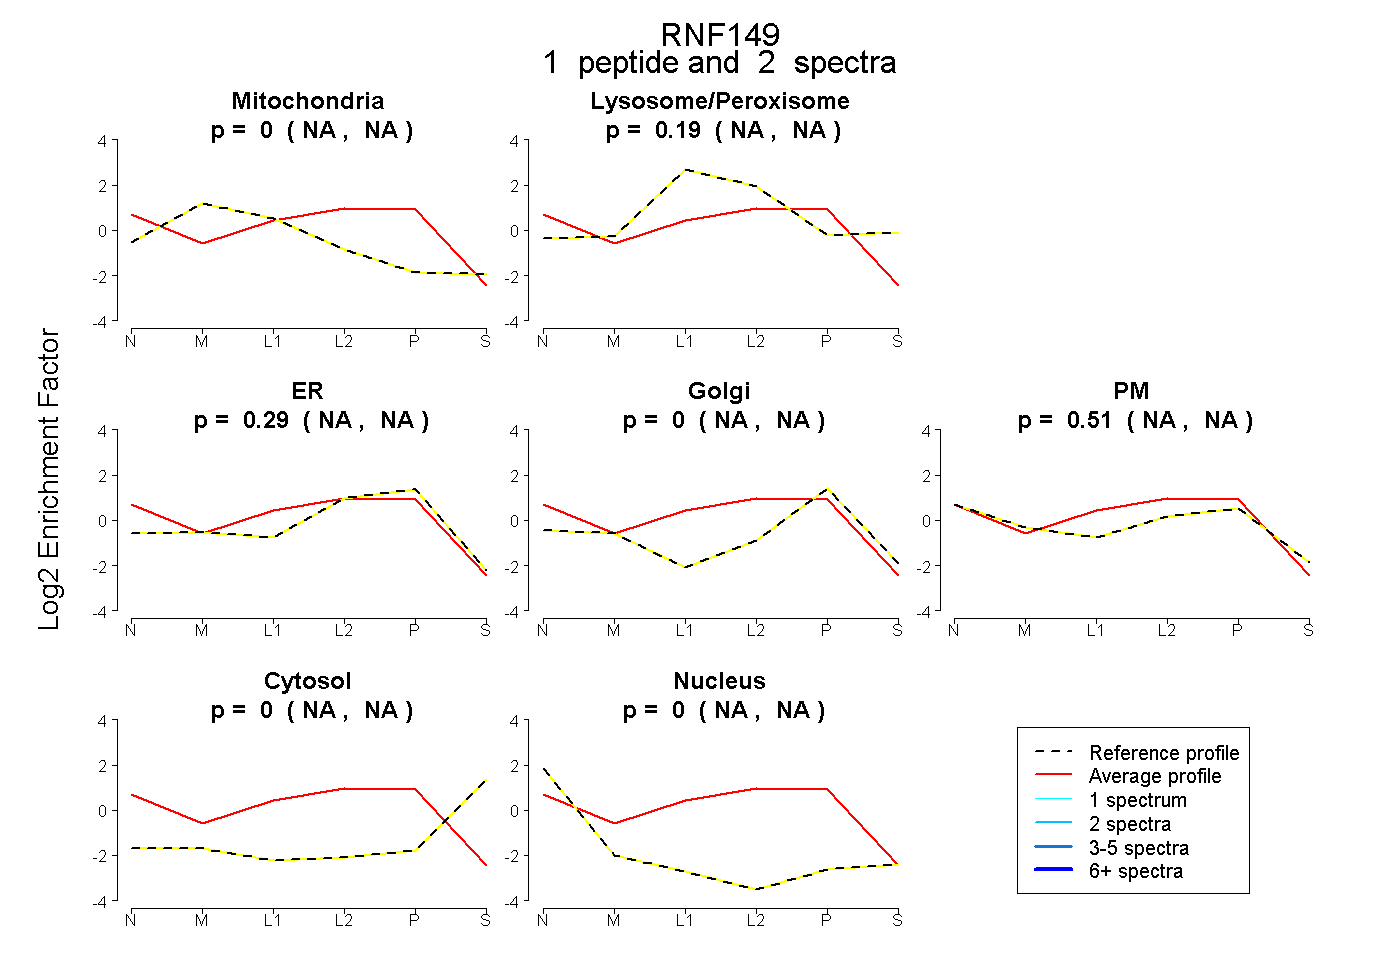
NA | NA
NA | NA
NA | NA
NA | NA
NA | NA
NA | NA
NA | NA
4peptides
spectra
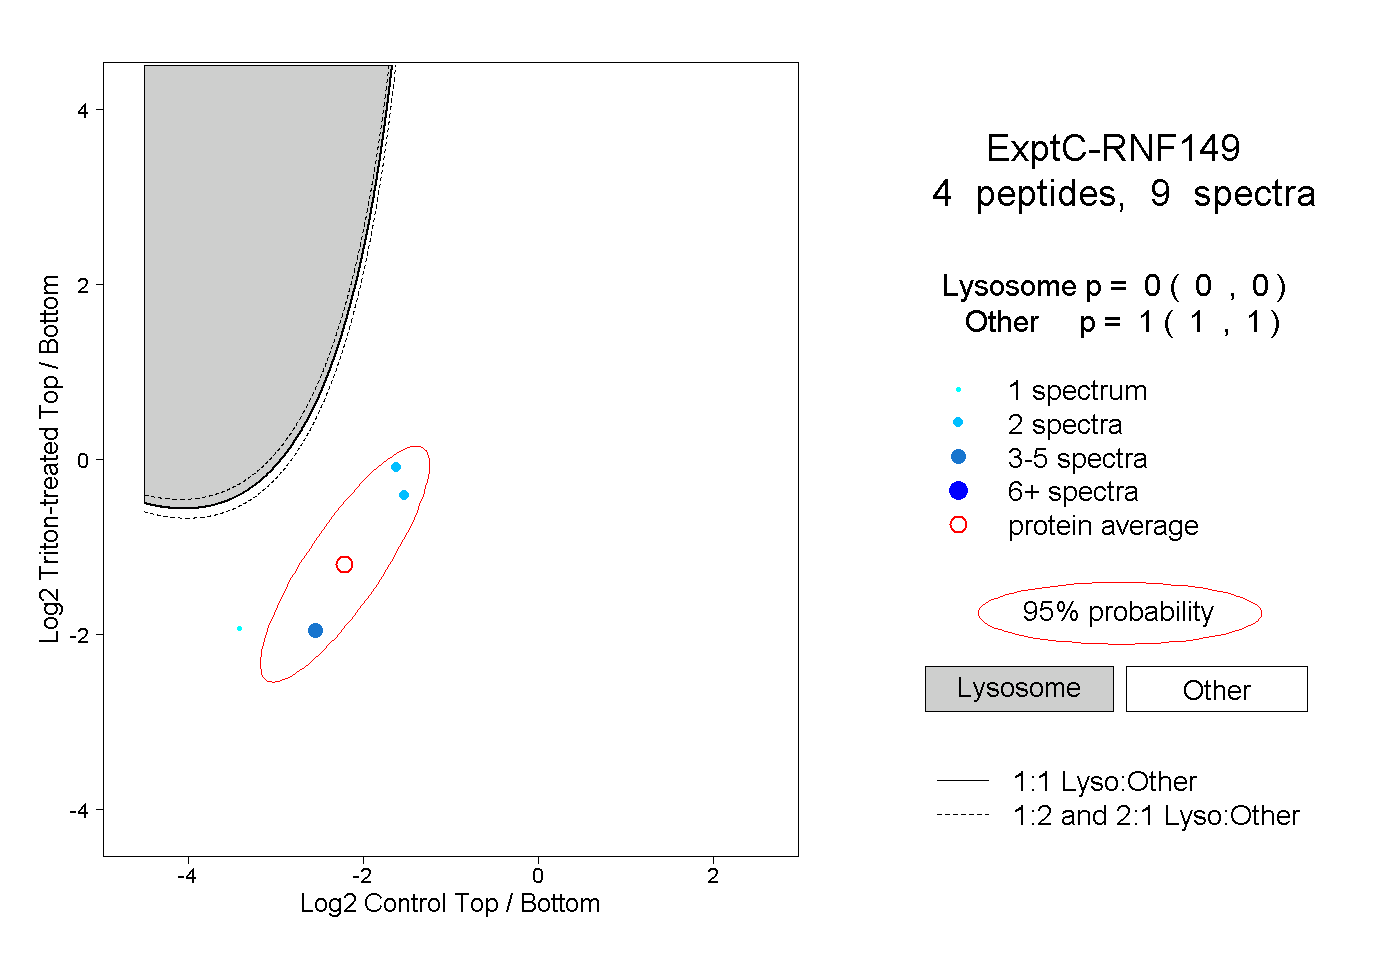
0.000 | 0.000
1.000 | 1.000
3peptides
spectra
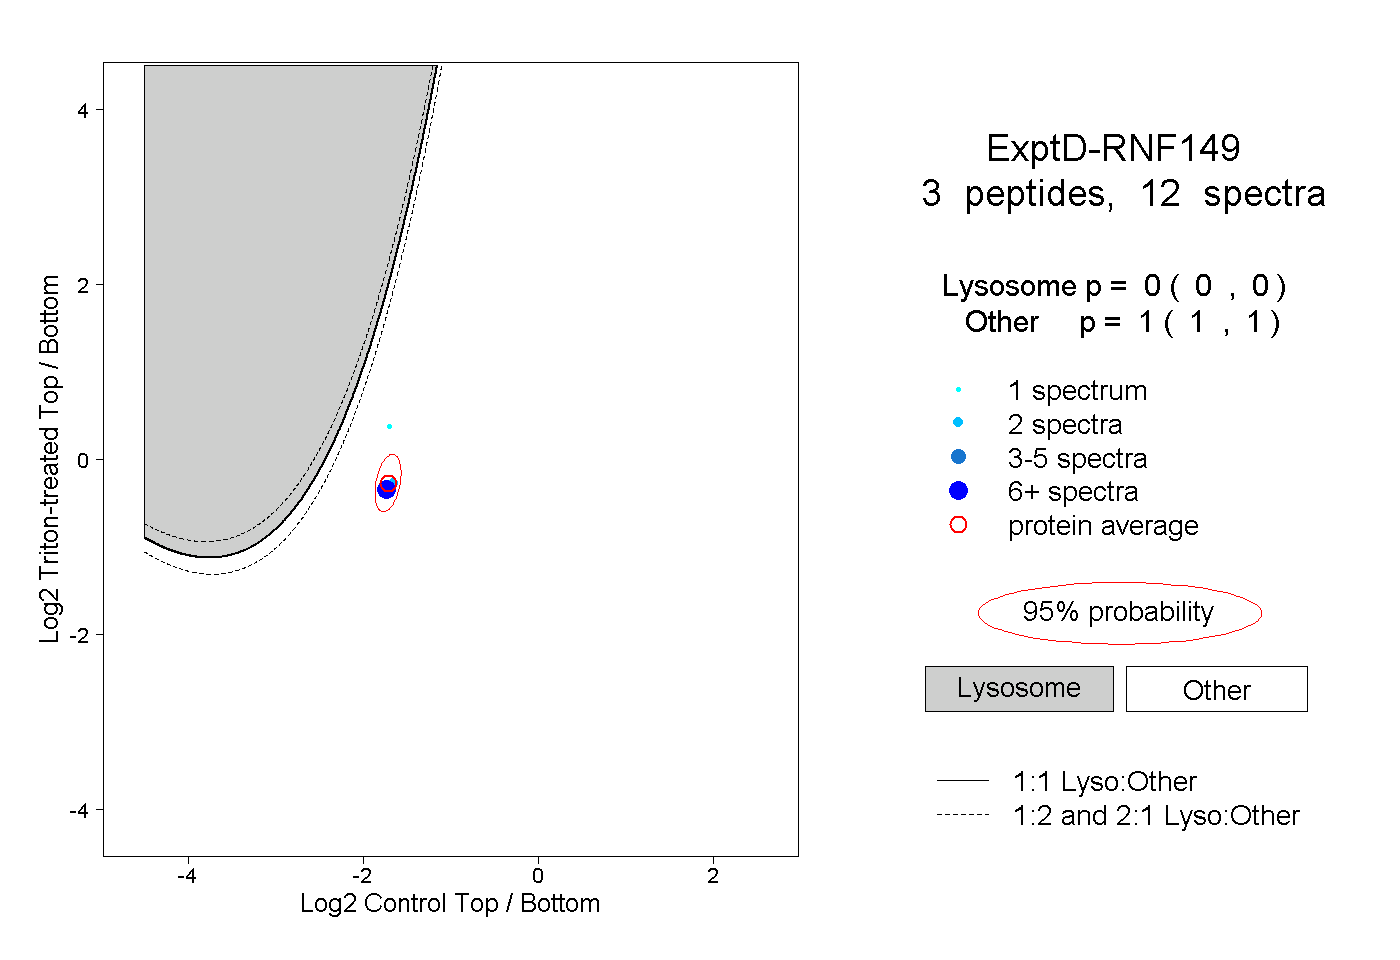
0.000 | 0.000
1.000 | 1.000